
Field Notes Entry
A Year in the Life of a Dandelion (Abingdon)
Extending the plant comparison, showing how Dandelion maintains a visible presence across a much longer flowering season
Following on from the Daisy analysis, it’s interesting to look at a plant with a rather different seasonal strategy.
The Dandelion (Taraxacum officinale) is equally familiar, widespread, and present throughout the year — but unlike Daisy, it is notably more persistent, flowering over a much longer period and often reappearing quickly after disturbance.
Monthly Sightings
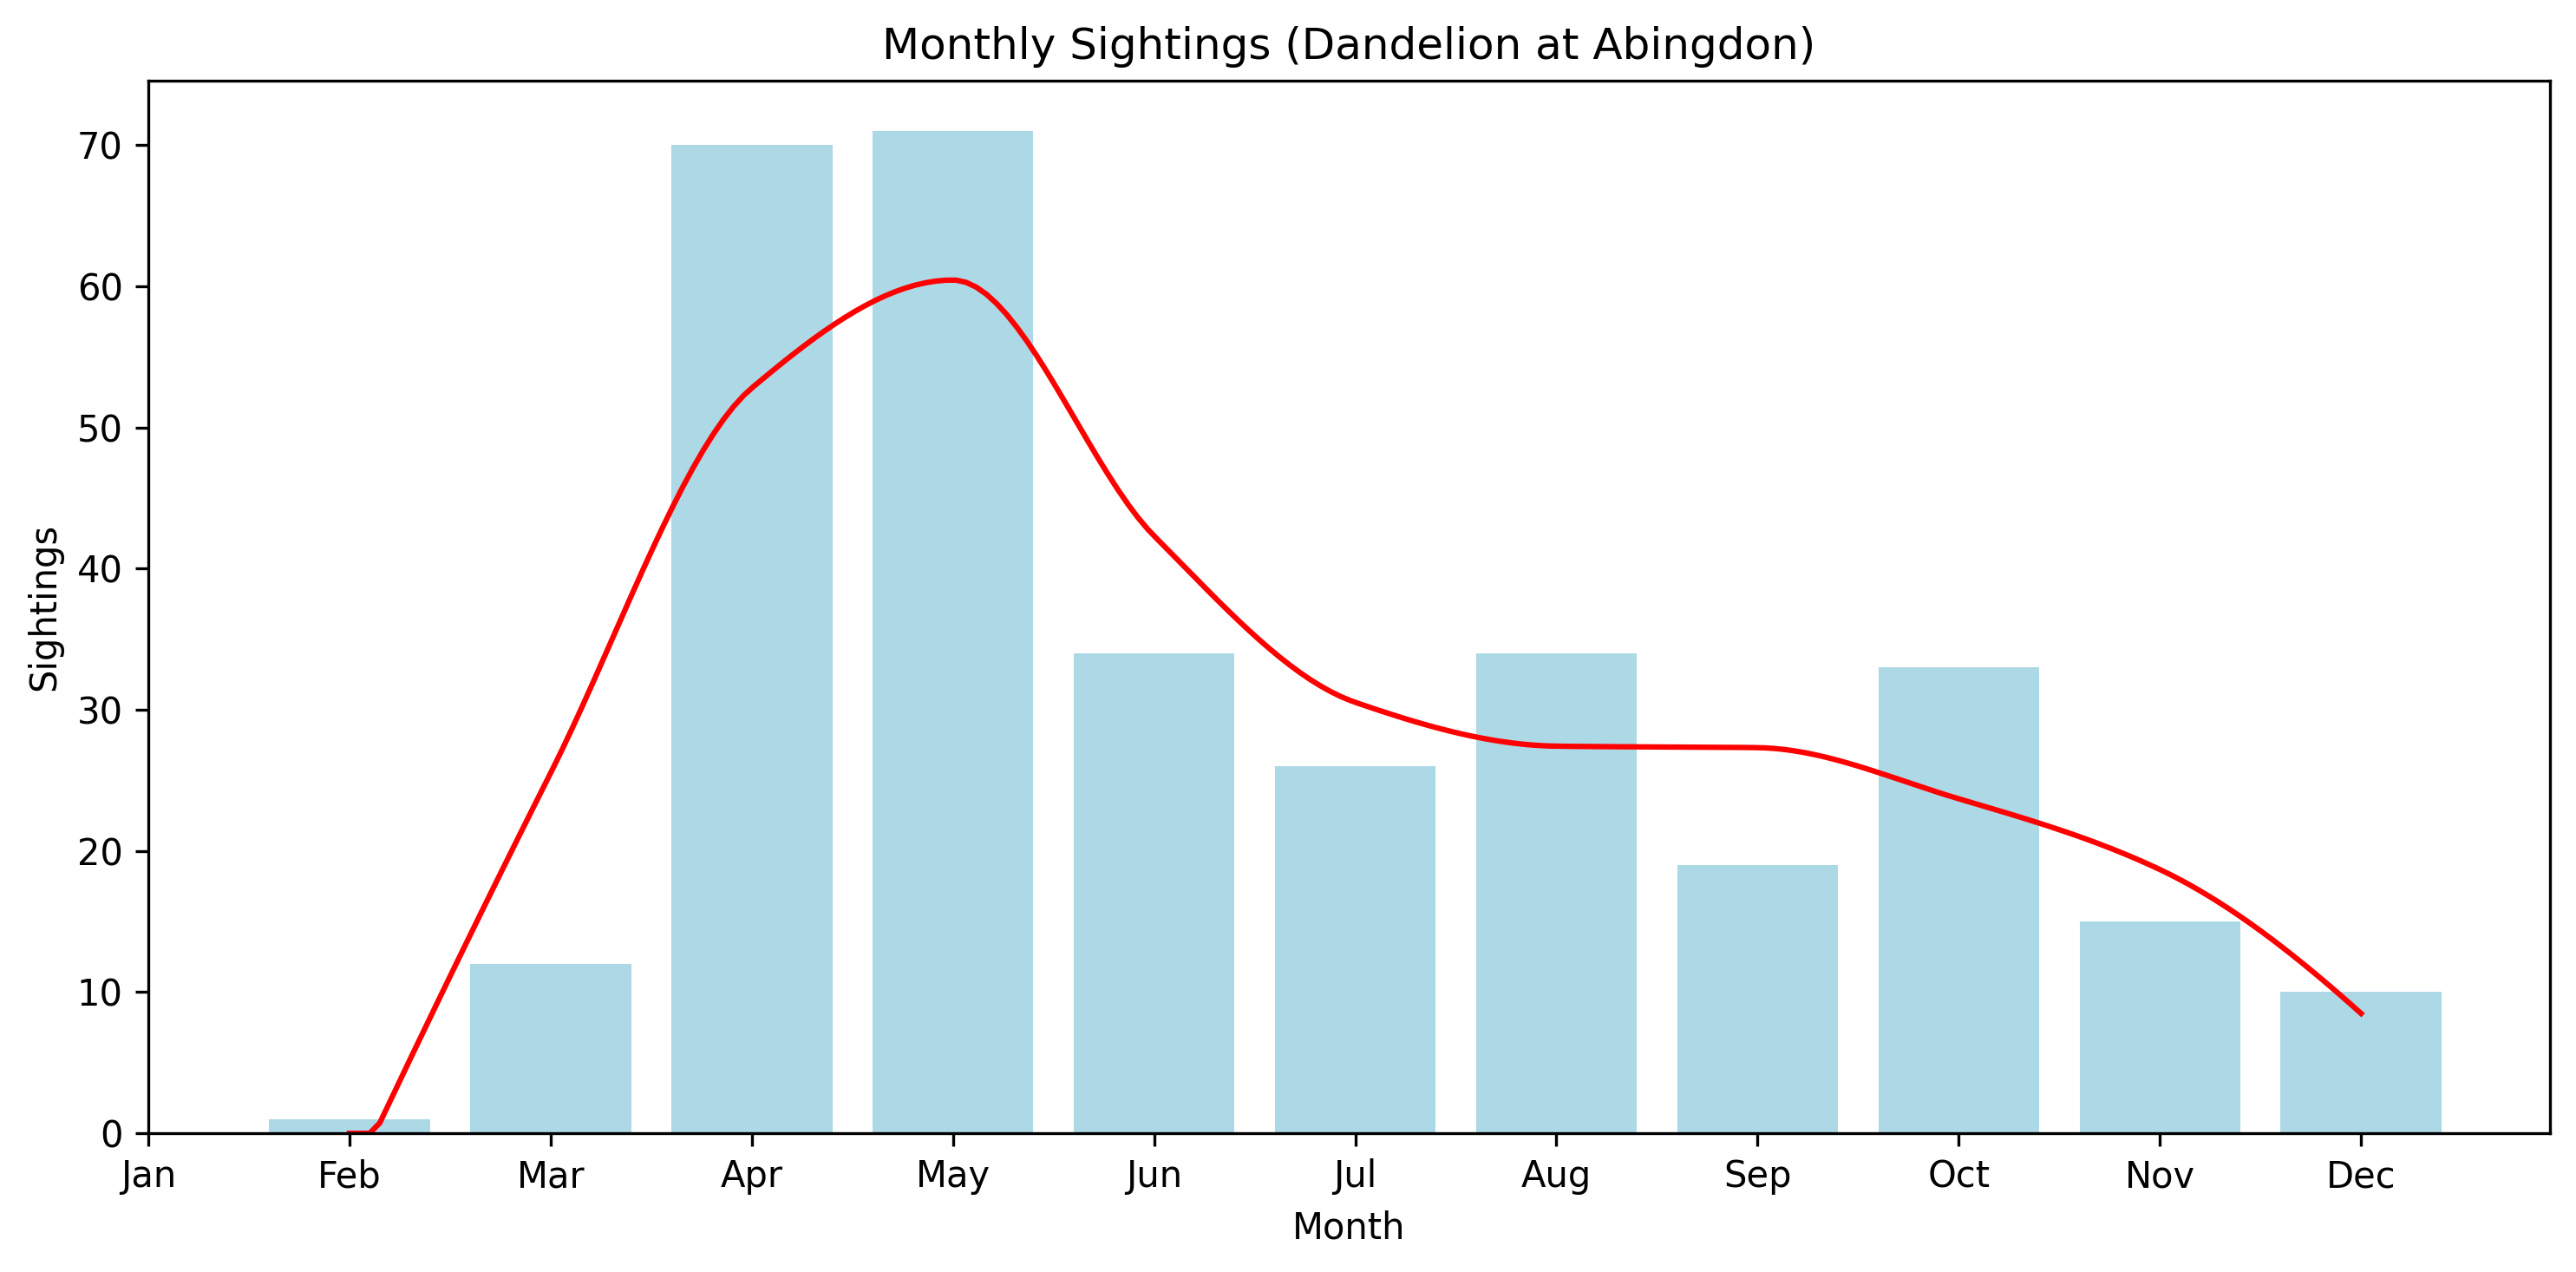
The overall pattern retains a recognisable seasonal structure, but with a broader shape:
- Very low counts in winter
- A rapid rise through early spring
- A peak in April and May
- A gradual decline rather than a sharp drop through summer
- Continued presence into autumn
- A return to low levels by late autumn and winter
Compared with Daisy, the most striking feature is the extended tail: rather than falling away quickly after the spring peak, Dandelion remains visible across much of the year.
Presence — How Often Are They Seen?
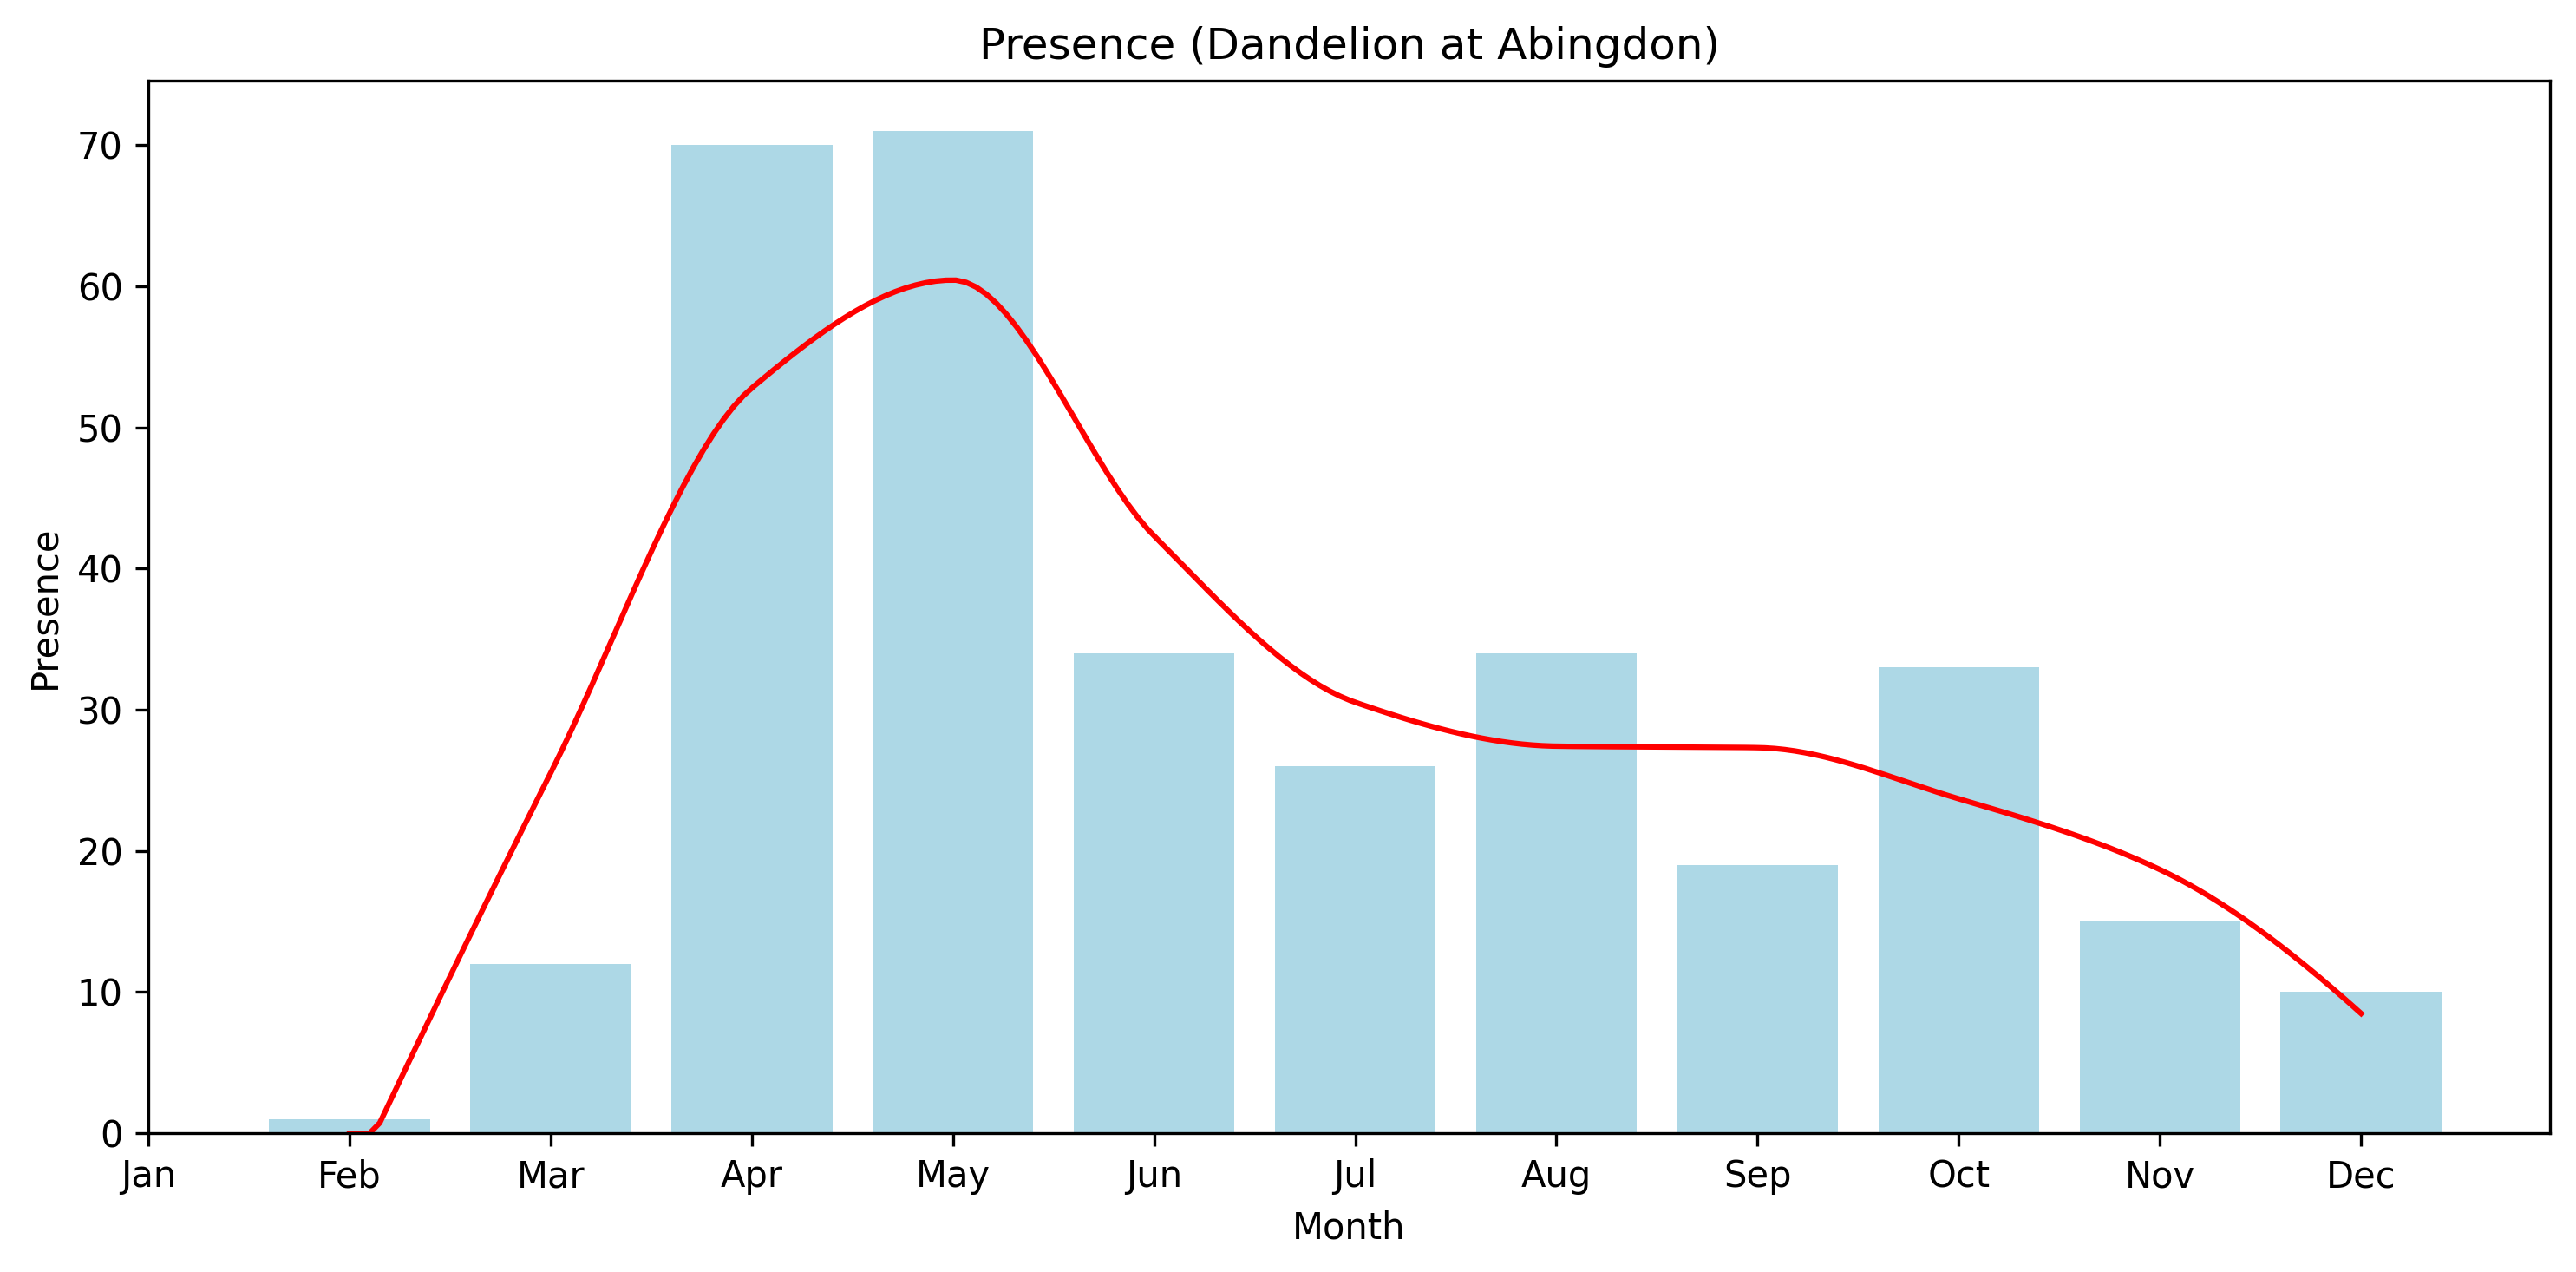
As with Daisy, the pattern of encounter frequency closely mirrors the total sightings.
The rise, peak, and gradual decline are all reproduced almost exactly, suggesting that both measures are capturing the same underlying signal.
Interpreting the pattern
In this case, as with Daisy, the charts are best understood as reflecting the plant’s visible life cycle rather than changes in detectability alone.
The Dandelion remains visible over a longer portion of the year, owing to its extended and opportunistic flowering behaviour.
The strong spring peak corresponds to the main flowering period, when plants are abundant and conspicuous.
The key difference emerges through summer and into autumn. Rather than disappearing from view, Dandelions:
- Continue to flower intermittently
- Re-flower following mowing or disturbance
- Persist in open or disturbed ground where competition is reduced
This results in a prolonged period of visibility, with a gradual taper rather than a sharp decline.
A modest secondary structure in late summer and autumn is also apparent, consistent with renewed flowering under less competitive conditions.
Daisy and Dandelion — A Comparison
Seen together, Daisy and Dandelion illustrate two closely related but distinct seasonal strategies.
| Feature | Daisy (Bellis perennis) | Dandelion (Taraxacum officinale) |
|---|---|---|
| Spring peak | Strong | Strong |
| Summer behaviour | Declines sharply | Declines but persists |
| Autumn recovery | Modest | Clear secondary phase |
| Detectability driver | Flowering, competition | Flowering, disturbance tolerance |
| Presence vs counts | Very similar | Very similar |
The Daisy shows a more concentrated flowering period, with visibility dropping off relatively quickly as competition increases.
The Dandelion, by contrast, is more opportunistic. Its ability to re-flower and exploit disturbed ground allows it to maintain a visible presence across a much longer portion of the year.
Comparing Patterns Across Species
Looking across the species examined so far, some clear differences begin to emerge in how these seasonal curves arise.
| Type | What drives the curve | Key signal |
|---|---|---|
| Blackbird | Behaviour (moult, concealment) | Detectability drop |
| Robin | Behaviour, with earlier timing | Earlier seasonal dip |
| Daisy | Flowering, competition | Sharp spring peak |
| Dandelion | Extended flowering, disturbance tolerance | Broad, persistent curve |
Although the charts themselves are produced in the same way, they are capturing quite different processes.
For the birds, the mid-summer lull reflects a period when individuals are present but less detectable. For the plants, the curves are more directly tied to flowering and visibility.
A Note On The Data
As with the other analyses, these records come from informal observations rather than structured surveys. Counts vary, and recording effort is not uniform through the year.
The charts should therefore be read as indicative patterns. The consistency of the seasonal shape across years is what makes the signal meaningful.
Closing Thoughts
What’s particularly striking is how a simple aggregation by month — applied consistently across different species — can reveal these contrasting seasonal signatures.
The Dandelion, in this context, stands out not for a sharp peak, but for its persistence: a species that remains visible, in one form or another, across much of the year.
Set alongside the Daisy and the birds, it helps to illustrate how differences in life cycle and ecology shape not just what is present, but what is seen.
Data for this chart is available to download here: