
Field Notes Entry
A Year in the Life of a Daisy (Abingdon)
A comparison with the bird analyses, showing how seasonal patterns in a common plant reflect flowering cycles rather than changes in detectability
Following on from the bird analyses, it’s interesting to ask how the same approach works for a very different kind of organism.
The Daisy (Bellis perennis) provides a useful contrast: common, widespread, and present throughout the year — but unlike the birds, not mobile, and not subject to changes in behaviour in the same way.
Monthly Sightings
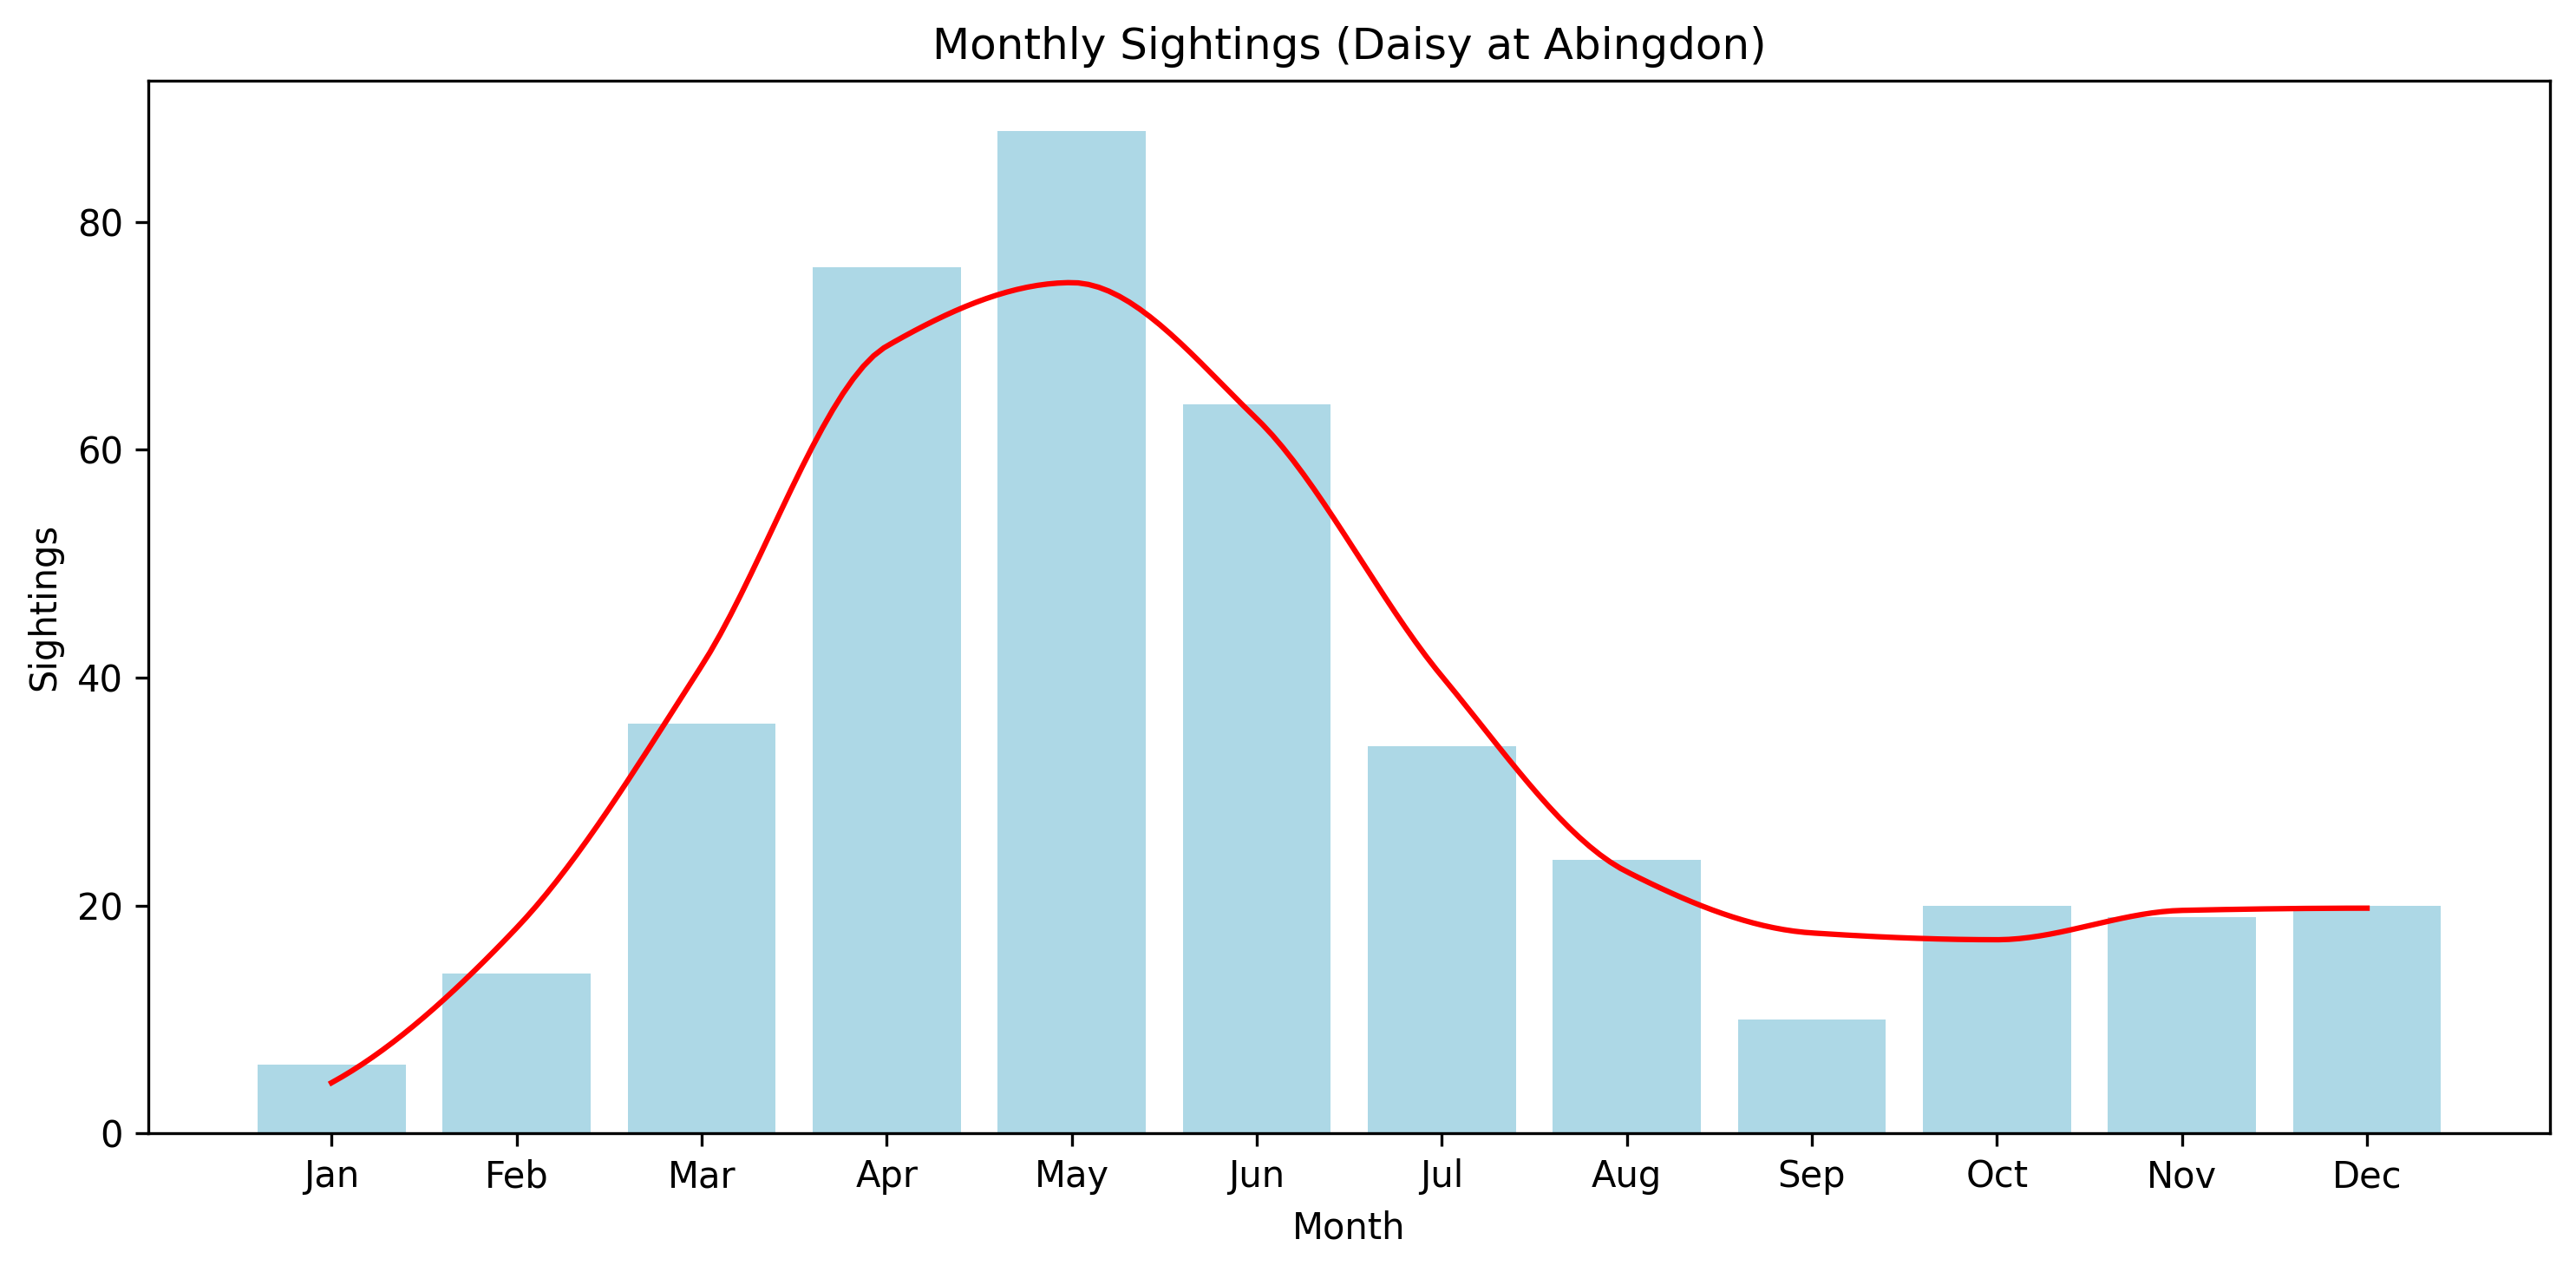
The overall pattern is again clear, but differs in character:
- Very low counts in winter
- A steady rise through early spring
- A peak in April and May
- A gradual decline through summer
- A low point in late summer/early autumn
- A modest recovery in autumn
Presence — How Often Are They Seen?
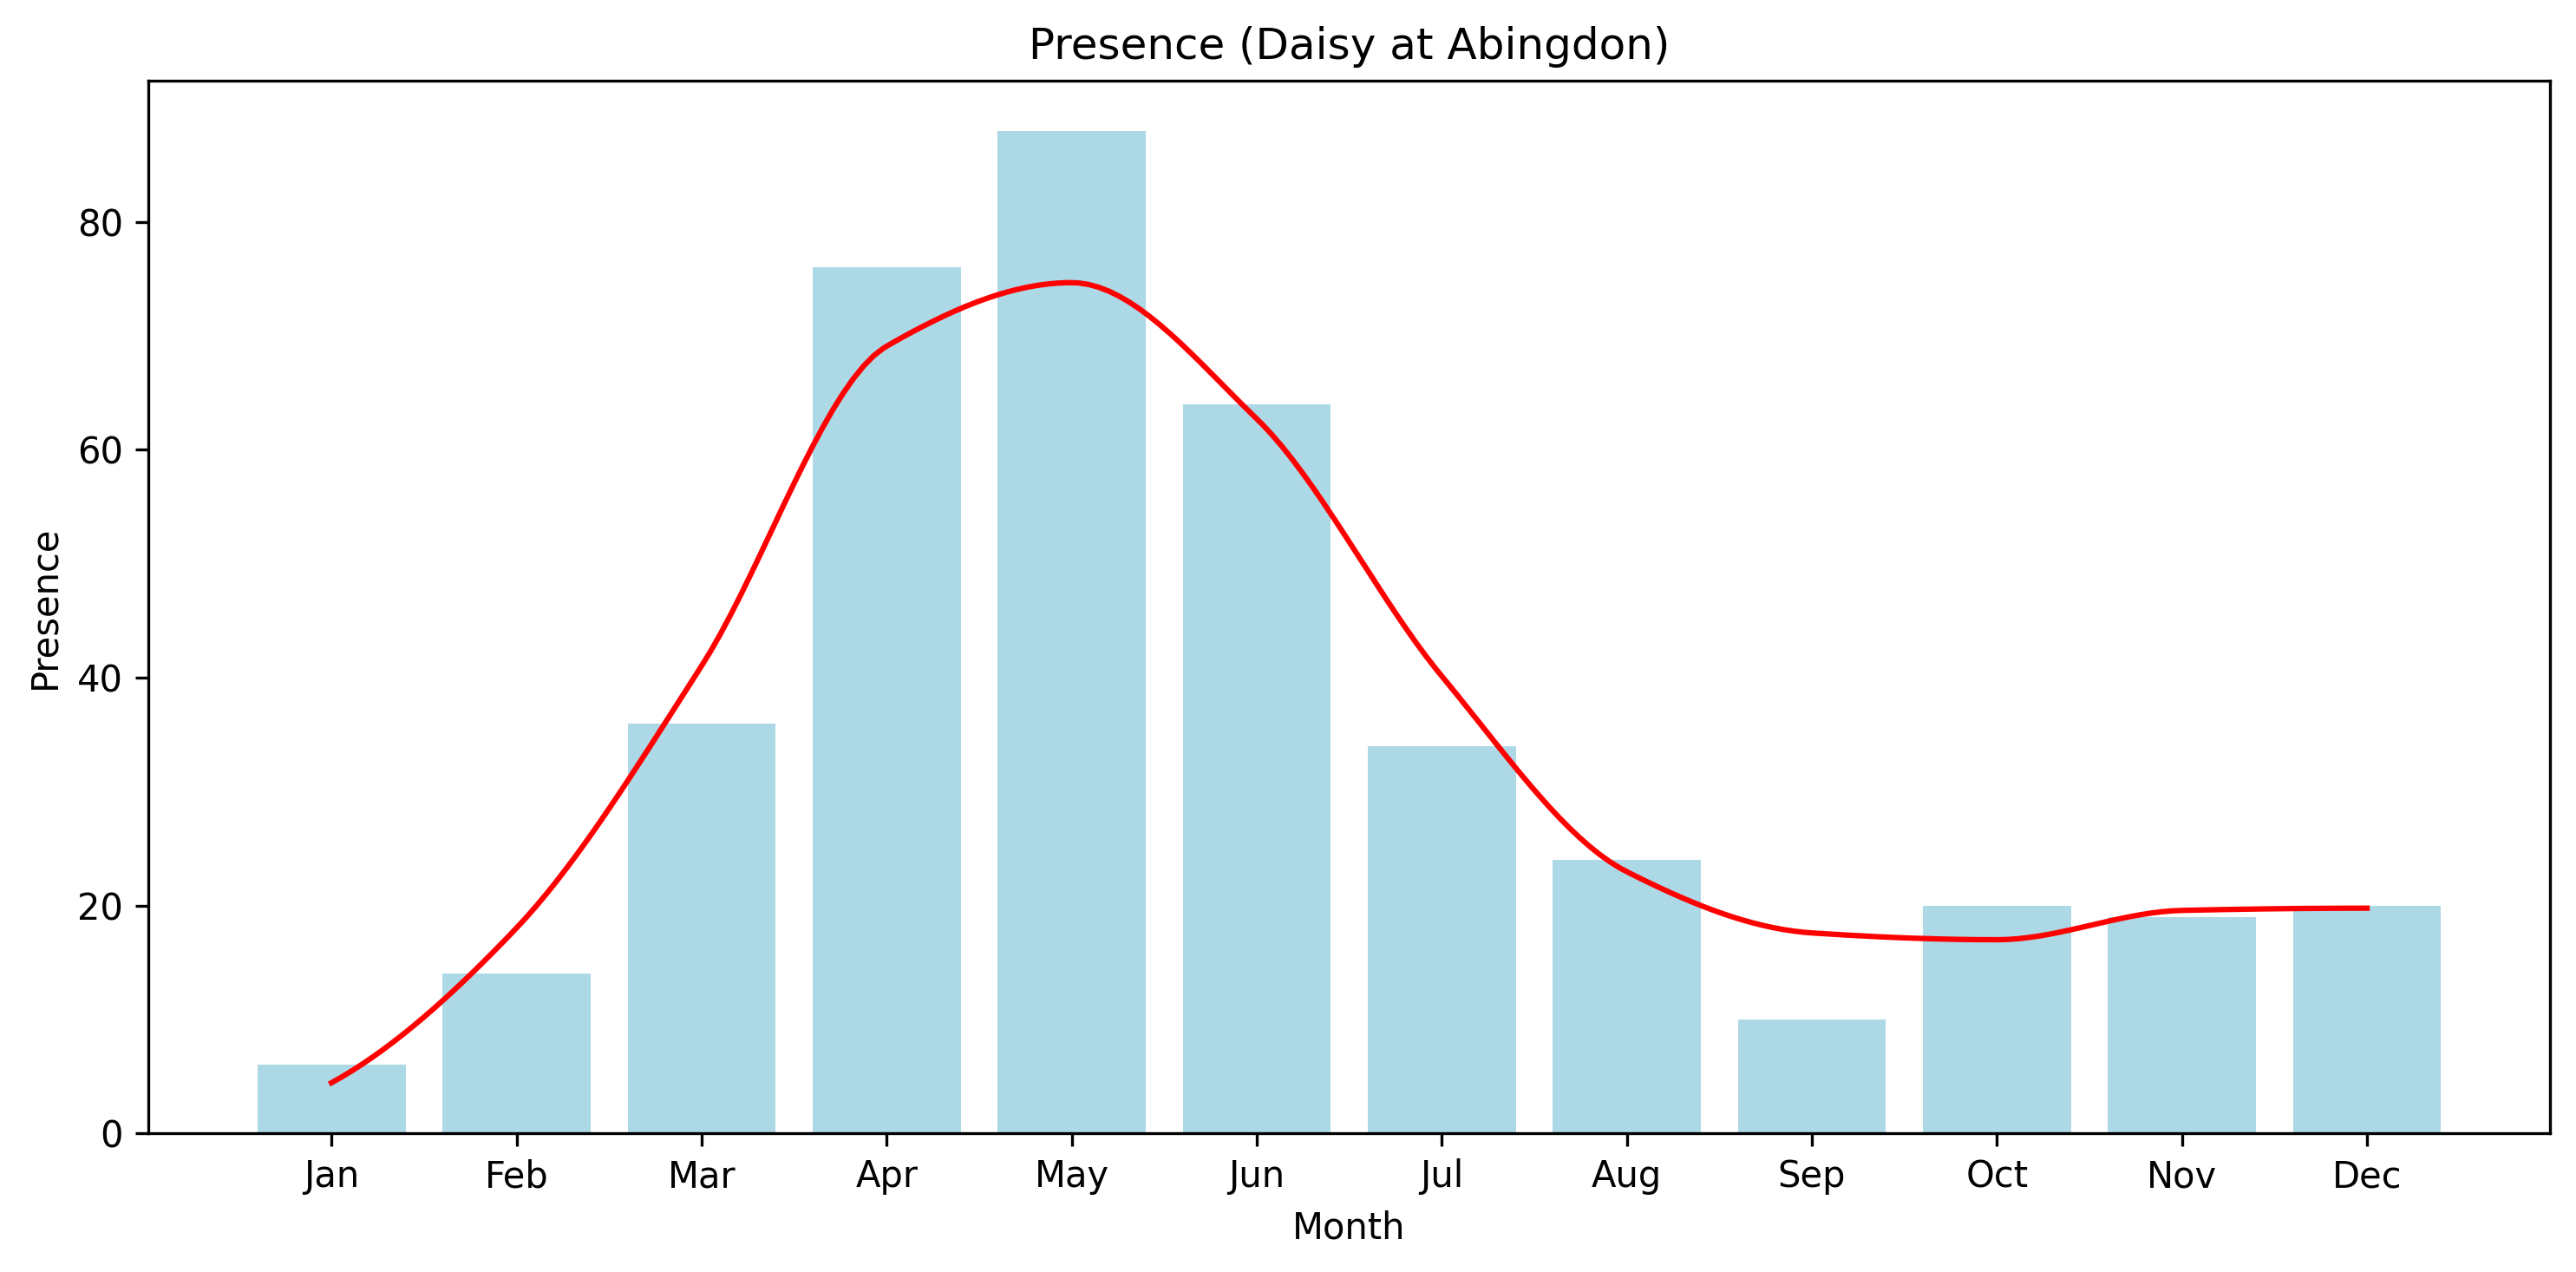
Looking at encounter frequency — the number of days on which Daisy was recorded — reinforces the same shape.
Unlike the Robin and Blackbird results, however, the two charts closely mirror one another. The rise and fall in total sightings is matched almost exactly by the likelihood of encountering the plant at all.
Interpreting the pattern
In this case, it is more reasonable to read the pattern as reflecting the plant’s visible life cycle rather than changes in detectability alone.
The Daisy becomes more or less visible through the year, largely in step with its flowering cycle.
The spring peak corresponds closely with the main flowering period. At this time:
- Plants are actively producing flowers
- Lawns and verges are relatively open
- Individual plants are easy to notice and record
Through the summer, several factors likely contribute to the decline:
- A reduction in flowering after the spring peak
- Increasing competition from surrounding vegetation
- The effects of mowing, which removes flower heads before they are recorded
By late summer, the species reaches a low point in visibility — not necessarily because the plants are absent, but because they are less often in flower and more easily overlooked.
The modest recovery into autumn is consistent with a secondary flowering phase, combined with reduced competition as growth in surrounding vegetation slows.
A Note On The Data
As with the bird analyses, these records come from informal observations rather than structured surveys. Counts vary, and recording effort is not uniform through the year.
For that reason, the charts are best read as indicative patterns. The strength of the signal lies in its consistency across years rather than in the precise values.
Closing Thoughts
Set alongside the Robin and Blackbird results, this provides an interesting contrast.
The birds show a mid-summer lull driven largely by behaviour — a period when they are present but less detectable. The Daisy, by comparison, shows a pattern that is more directly tied to seasonal growth and flowering.
Using the same simple approach across different kinds of species begins to reveal these differences: not just when things are seen, but why they are more — or less — visible at different times of year.
Data for this chart is available to download here: