
Field Notes Entry
A Year in the Life of a Chiffchaff (Abingdon)
A seasonal visitor whose pattern reflects arrival and departure rather than changes in detectability
Following on from the analyses of resident birds and common plants, it’s interesting to look at a species for which the seasonal pattern is driven not by behaviour or flowering, but by arrival and departure.
The Chiffchaff (Phylloscopus collybita) is a familiar spring migrant in the UK, and well represented in the Abingdon records.
Monthly Sightings
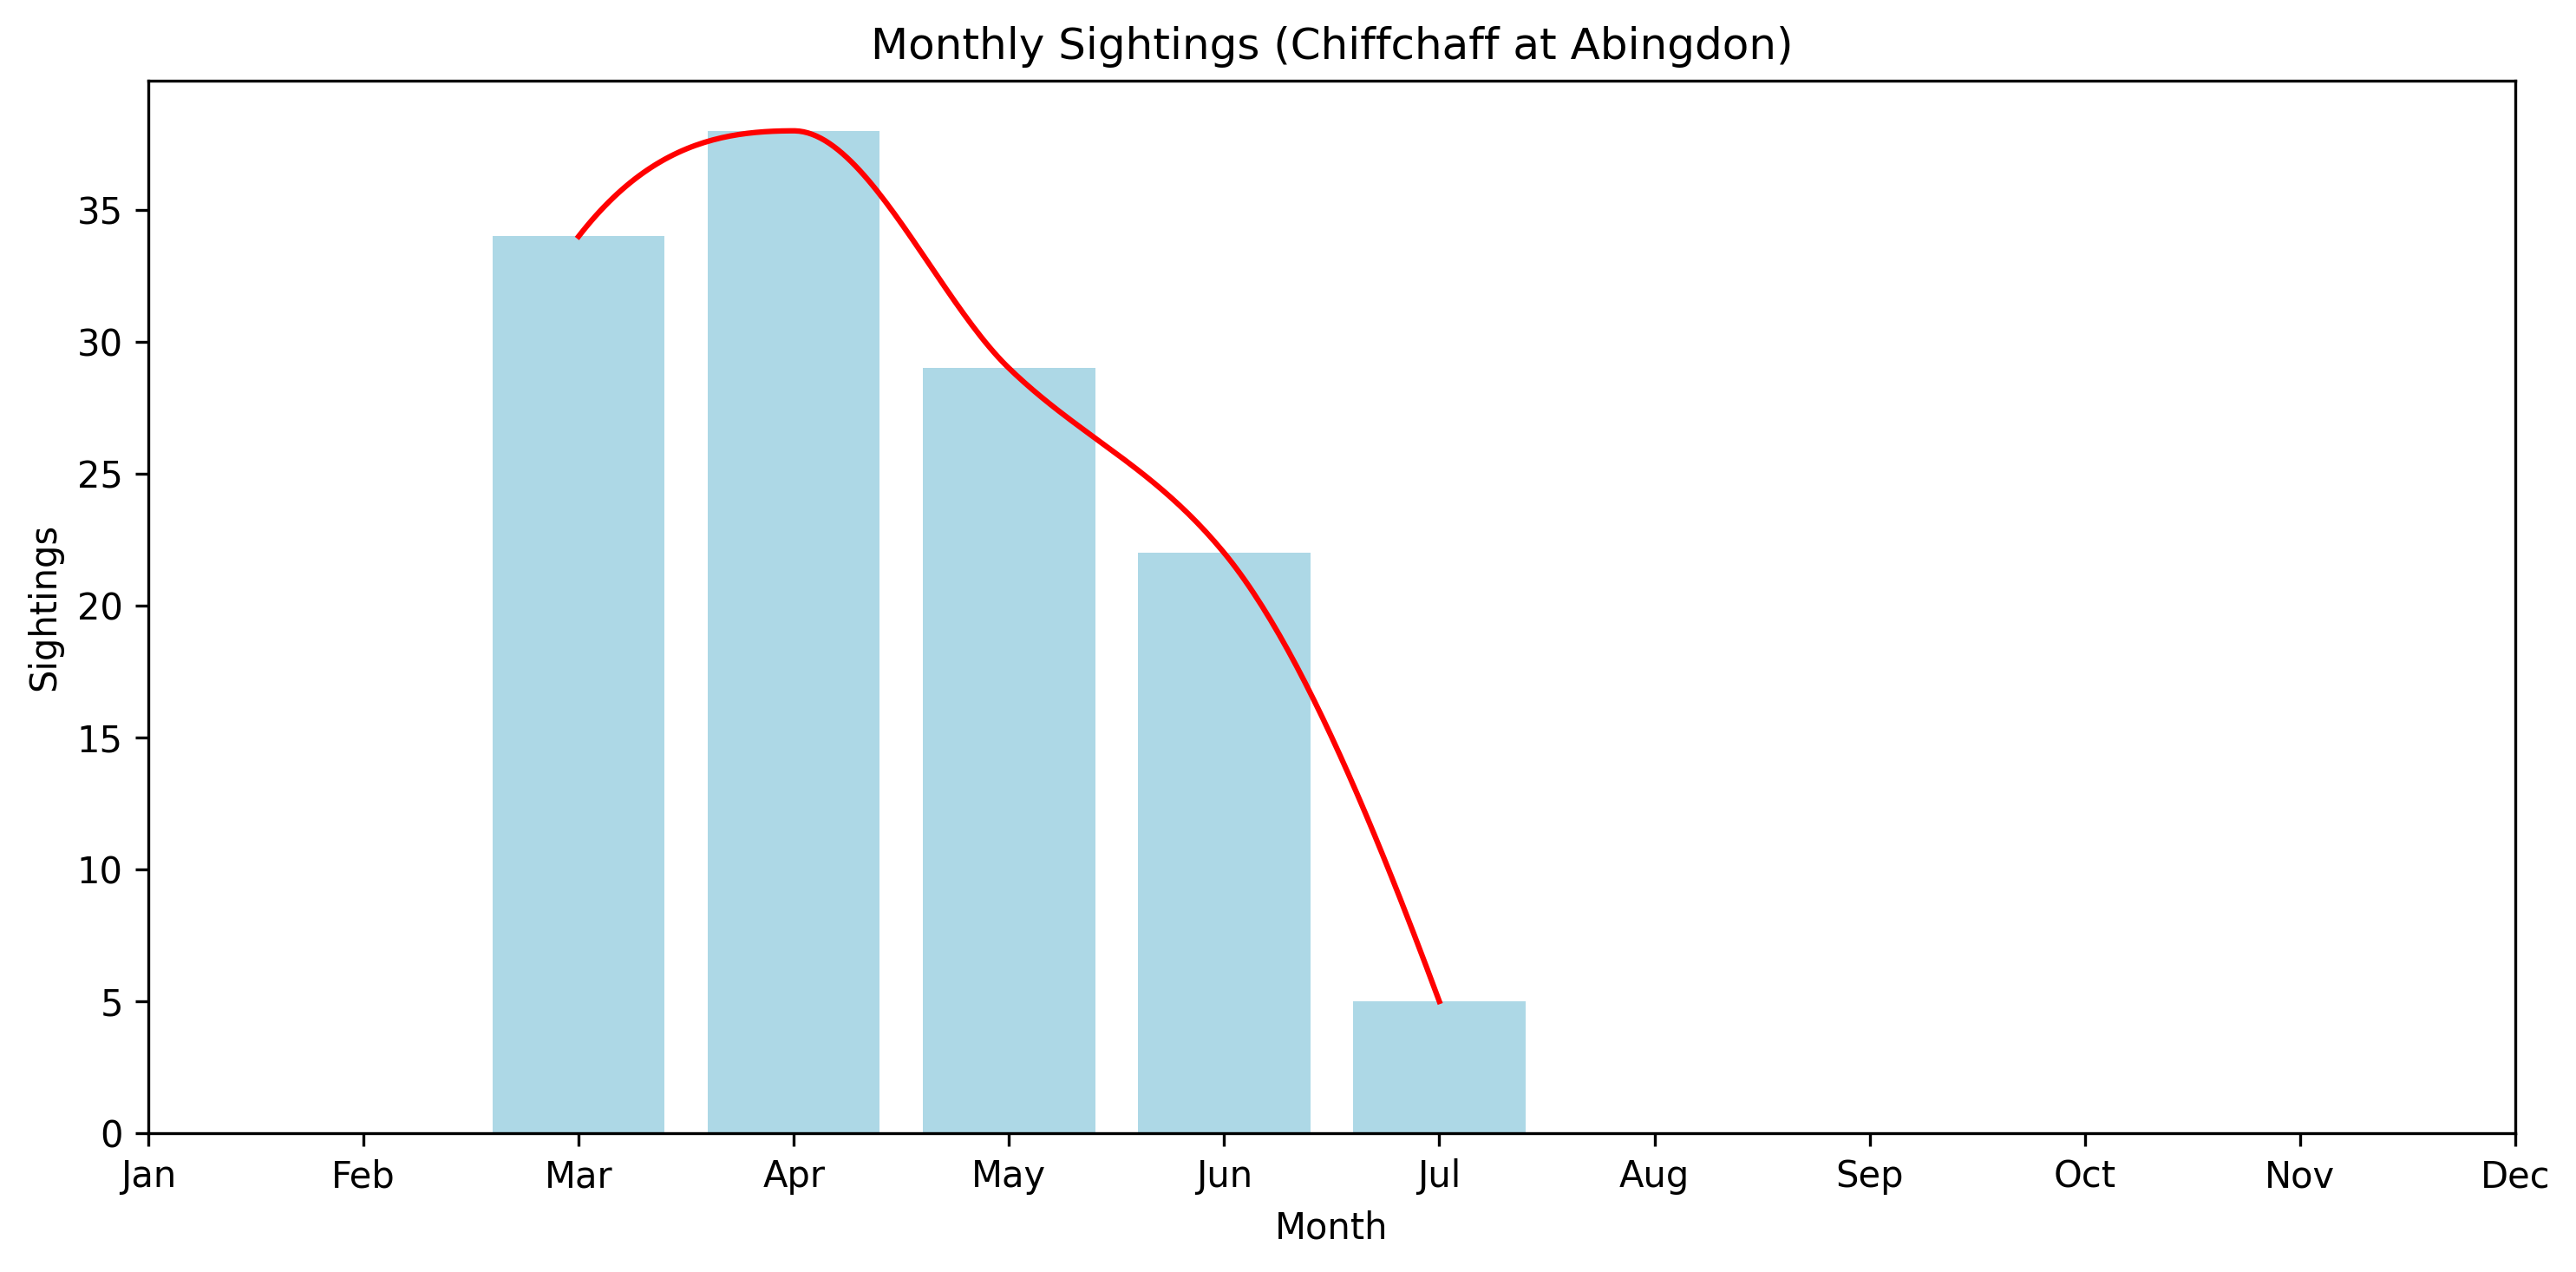
The pattern here is immediately striking:
- No records through winter
- A sudden appearance in March
- A peak in April
- A steady decline through May and June
- Very few records by July
Unlike the resident species, there is no suggestion of year-round presence — the curve begins and ends cleanly.
Presence — How Often Are They Seen?
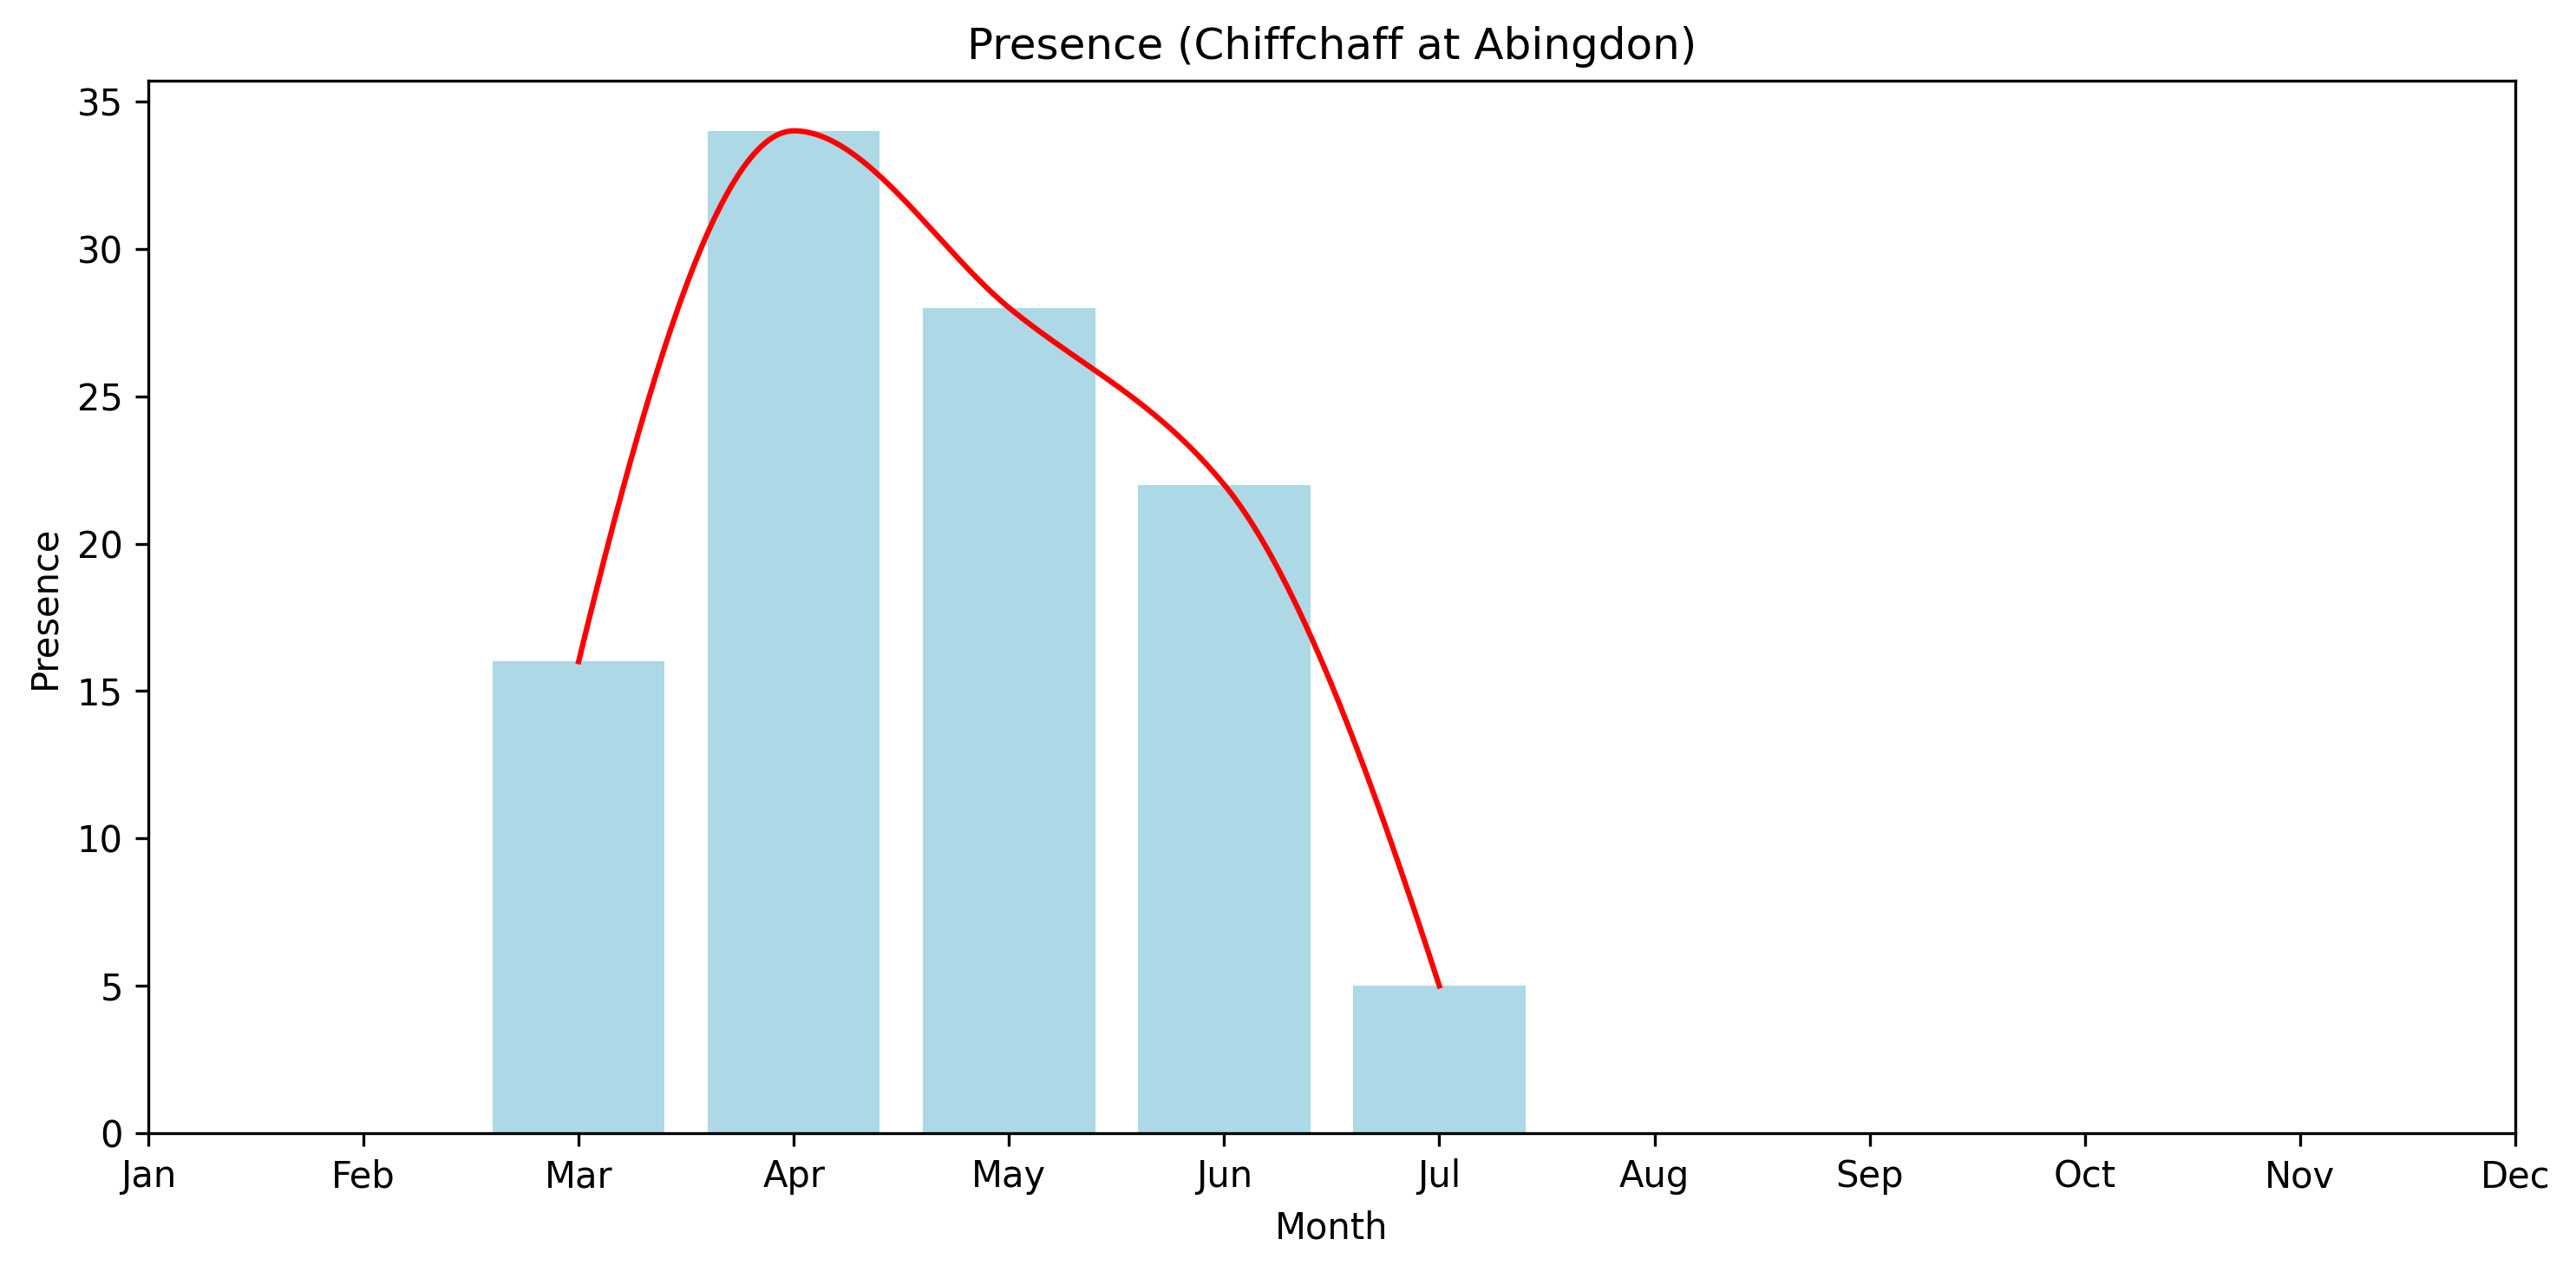
Looking at encounter frequency reinforces the same pattern.
The rise, peak, and decline are all closely mirrored, suggesting that both measures are capturing the same underlying process.
Interpreting the pattern
This is perhaps the clearest example so far of a different kind of seasonal signal.
The Chiffchaff curve reflects presence and absence in the local area, rather than changes in detectability alone.
The abrupt rise in March corresponds to spring arrival, when birds return to establish territories. At this point they are highly conspicuous, with frequent and persistent song.
The peak in April aligns with maximum territorial activity, when both presence and detectability are at their highest.
The subsequent decline through May and June reflects a combination of factors:
- A reduction in song after territories are established
- More subdued behaviour during and after breeding
- The beginning of dispersal and early departure
By July, the species is largely absent from the local area, and records drop accordingly.
A Note On The Data
As with the other analyses, these records come from informal observations rather than structured surveys. Counts are typically low, and recording effort varies through the year.
The charts are therefore best read as indicative patterns. The clarity of the seasonal signal, however, makes the interpretation relatively robust.
Placing This Alongside Other Species
Seen alongside the earlier examples, the Chiffchaff highlights how similar-looking charts can arise from quite different underlying processes.
| Species | Primary driver of pattern | Key feature |
|---|---|---|
| Blackbird | Behaviour (moult, concealment) | Mid-summer dip |
| Robin | Behaviour, with earlier timing | Earlier seasonal dip |
| Daisy | Flowering and environmental factors | Spring peak |
| Dandelion | Extended flowering and persistence | Broad seasonal presence |
| Chiffchaff | Migration (arrival and departure) | Sharp seasonal window |
Although the method of analysis is the same, the meaning of the curves differs in each case.
Closing Thoughts
What stands out here is the clarity of the signal. Where the resident birds and plants require some interpretation, the Chiffchaff curve is more direct: a species that is simply present for part of the year, and absent for the rest.
Taken together, these examples suggest that even simple, long-term records can begin to separate out different aspects of seasonal change — behaviour, visibility, and presence — depending on the species being observed.
Data for this chart is available to download here: