
Field Notes Entry
A Year in the Life of a Robin (Abingdon)
A companion piece to the Blackbird analysis, showing a similar seasonal pattern in Robin, but with an earlier mid-summer lull
Following on from the Blackbird analysis, it’s interesting to ask whether that same late-summer pattern appears in other familiar species — and if so, whether it occurs at the same time.
The Robin (Erithacus rubecula) makes a good comparison: common, well-recorded, and present throughout the year in the same local area around Abingdon … and also another of my favourites!
Monthly Sightings
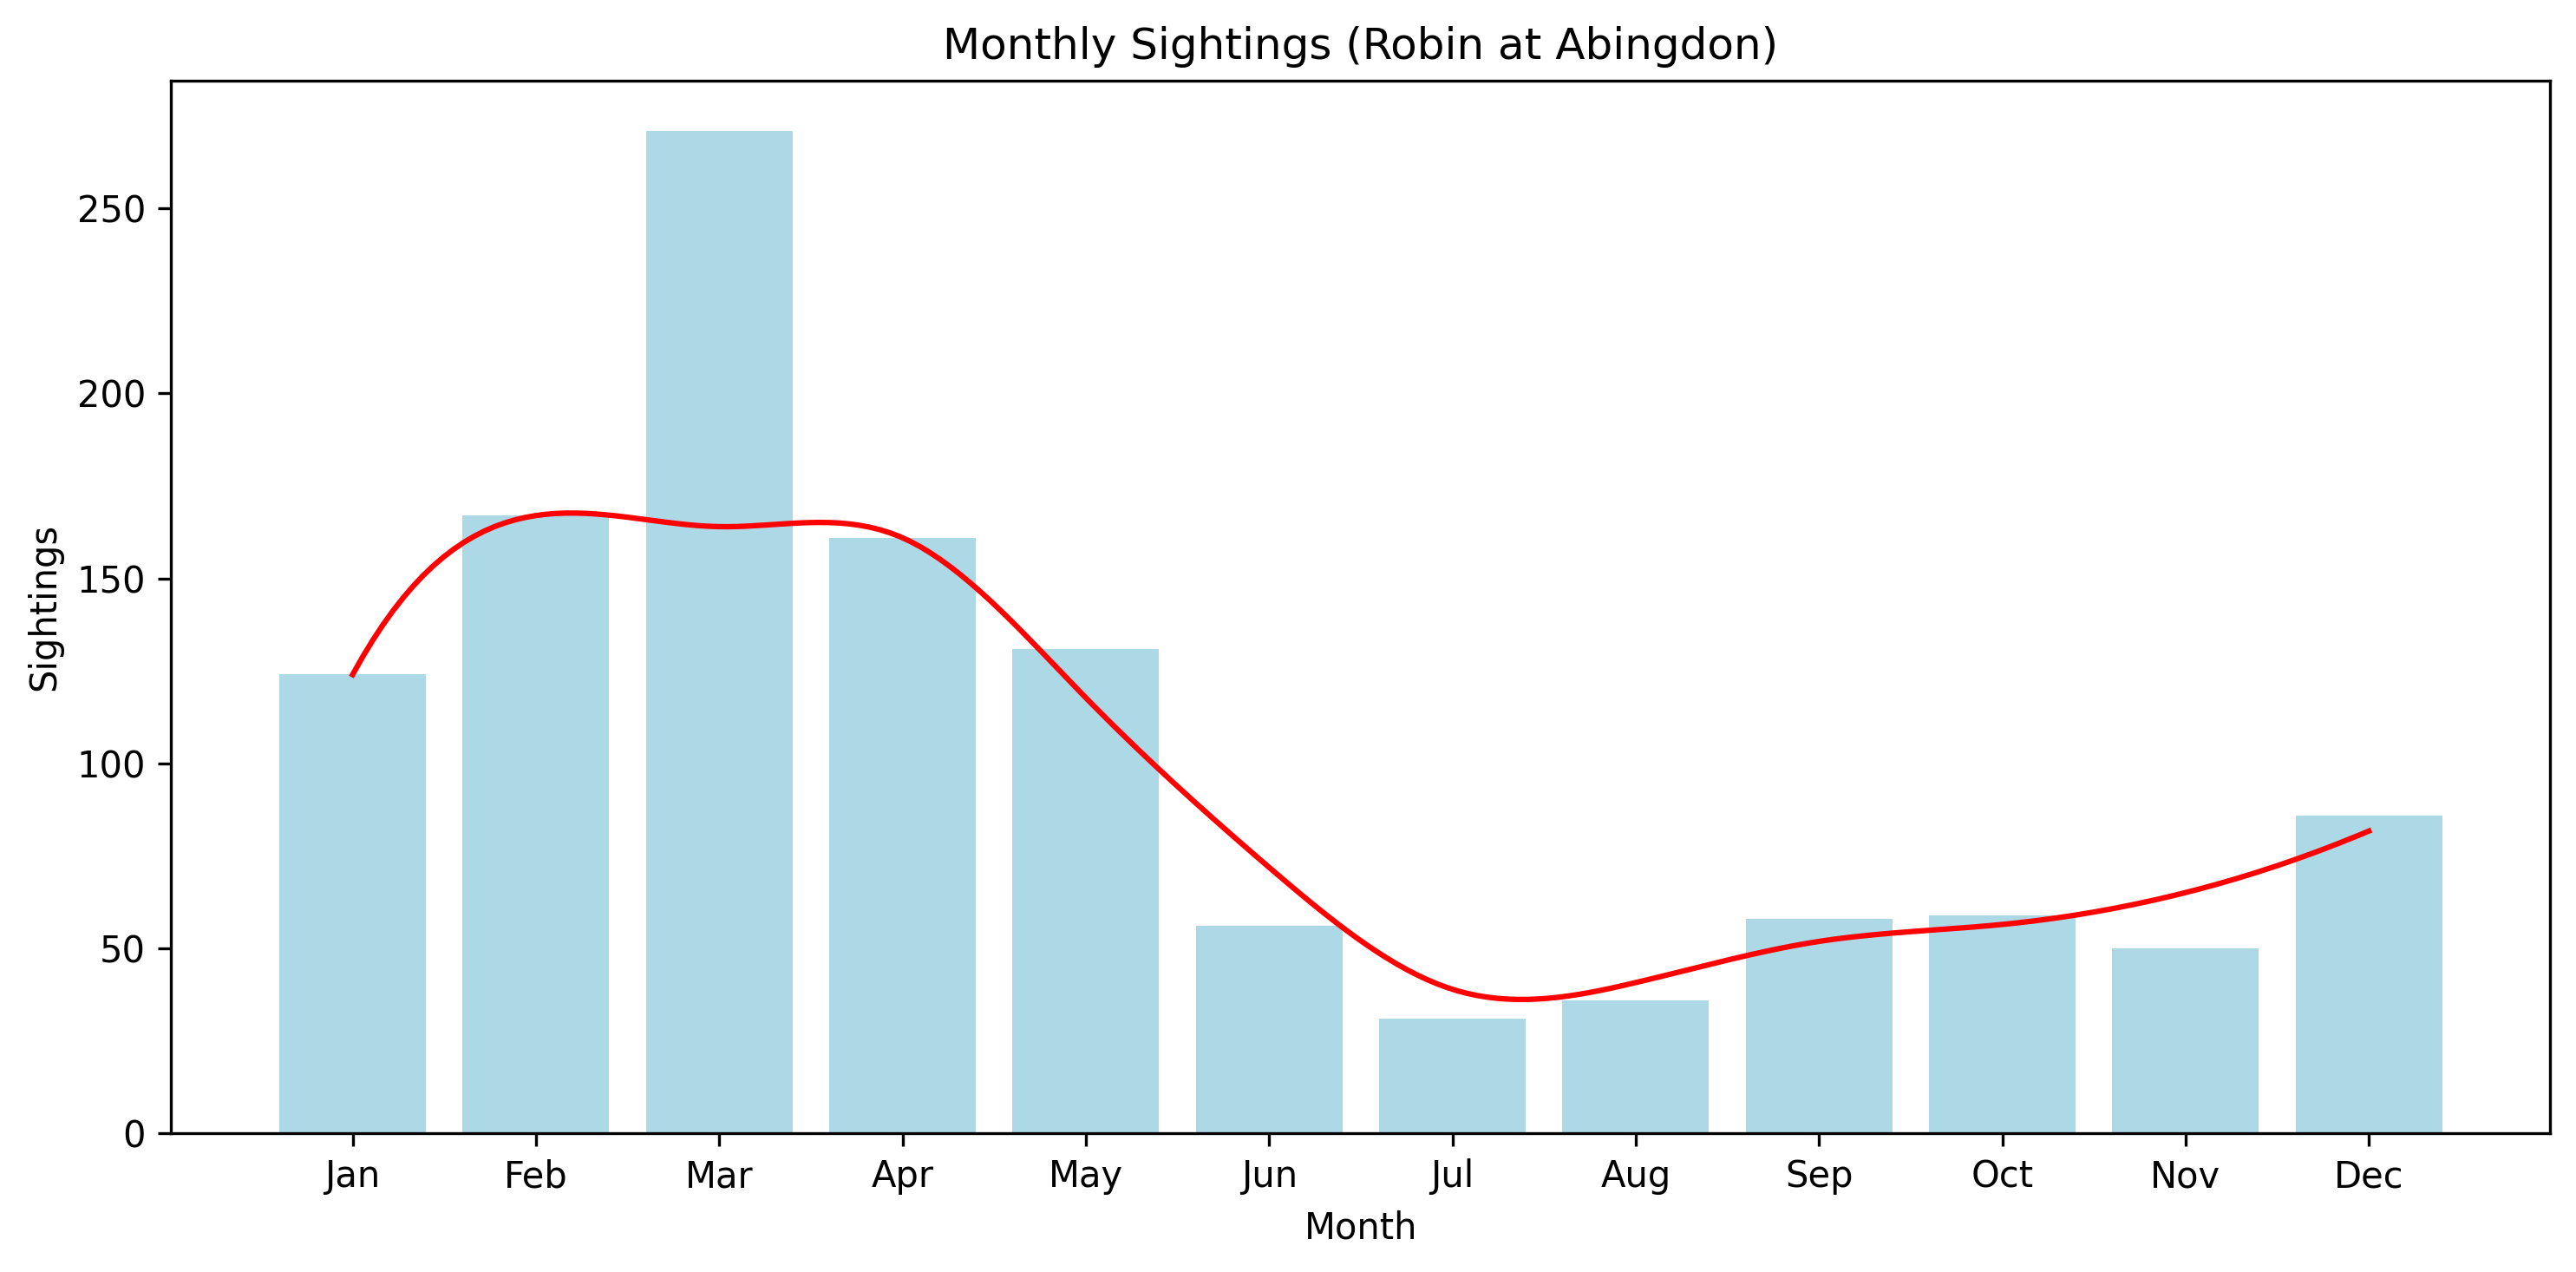
As with Blackbird, the overall shape is immediately recognisable:
- A rise through late winter into spring
- A peak in early spring
- A decline into mid-summer
- A recovery into autumn and early winter
But there is a subtle difference. The downturn begins earlier, and the low point appears to fall in July and August rather than August and September.
Presence — How Often Are They Seen?
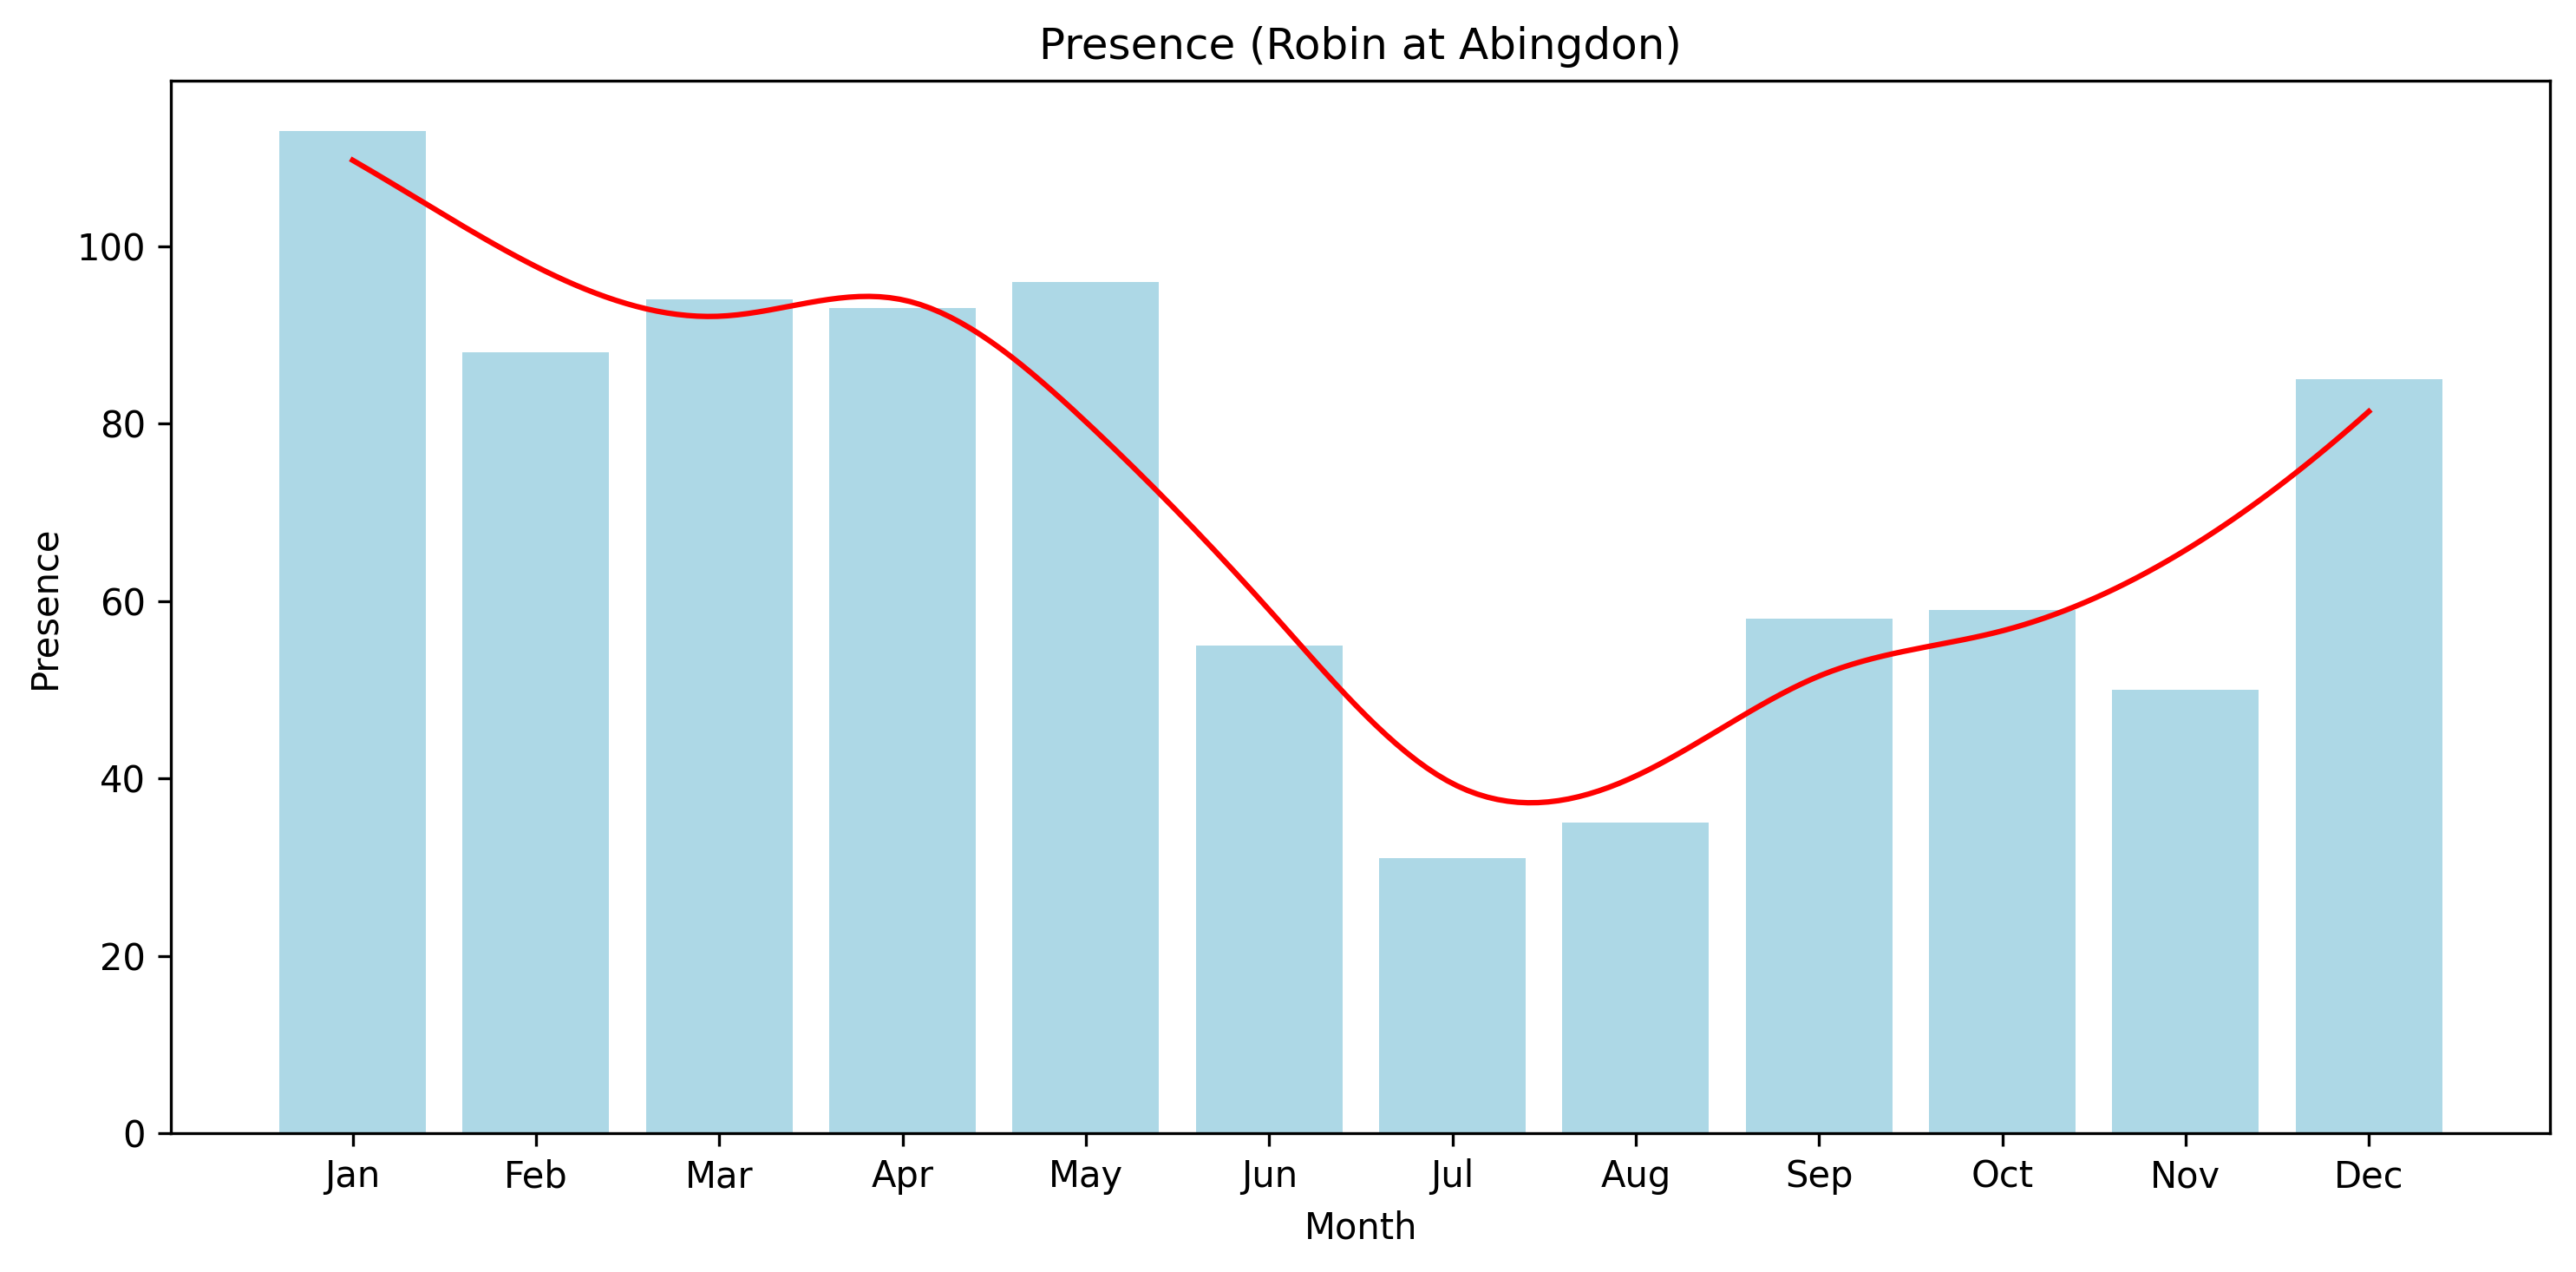
Looking at encounter frequency — the number of days on which a Robin was seen — brings this into clearer focus.
The same general pattern holds, but the mid-year dip is more cleanly defined, and shifted slightly earlier in the summer.
Interpreting the pattern
As with Blackbird, it would be misleading to conclude that Robins are simply “absent” at this time of year.
A more plausible reading is:
Robins become less detectable in mid-summer — and they do so slightly earlier than Blackbirds.
The most likely explanation is again the annual moult, but with a difference in timing.
For Robins, this post-breeding phase appears to begin earlier in the season. During this period, birds tend to be:
- Quieter, with a marked reduction in song
- More inclined to remain within cover
- Less frequently encountered in open, familiar feeding areas
In practical terms, it’s a point in the year when Robins — normally one of the most conspicuous and approachable birds — seem to withdraw somewhat from view.
Both charts support this interpretation:
- Total sightings fall away through July and August
- The likelihood of encountering a Robin drops more sharply still
The shift relative to Blackbird is small, but consistent — suggesting a real behavioural difference rather than a chance effect of the data.
A Note On The Data
As with the Blackbird analysis, these records come from informal observations rather than structured surveys. Counts are typically low, and recording effort varies through the year.
The charts are therefore best read as indicative patterns. What matters is not the exact values, but the consistency of the seasonal signal across years.
Closing Thoughts
Seen alongside the Blackbird results, this suggests a shared underlying rhythm — a mid-summer lull in visibility — but with species-specific timing.
Even among very familiar birds, small differences in seasonal behaviour begin to emerge when viewed across long runs of everyday observations.
Data for this chart is available to download here: