
Field Notes Journal Entry
Drawing the Seasonal Hierarchy
Visualising seasonal ecological neighbourhoods through hierarchical species similarity structure
The previous stage of the similarity analysis suggested that the emerging structure was not dividing cleanly into isolated ecological compartments.
Instead, the heatmap appeared to contain:
- Nested neighbourhoods
- Transitional regions
- Broad assemblages
- Smaller internal sub-groups
In other words, the structure itself appeared hierarchical.
The next logical step, therefore, was to visualise that hierarchy directly.
From Similarity Matrix to Hierarchical Structure
The species similarity matrix already contained the full clustering hierarchy internally and the heatmap represented one view of that structure by arranging species according to their relative similarity. However, the underlying hierarchy itself remained largely hidden.
Adding a dendrogram exposed that hierarchy explicitly. Rather than simply showing which species sit near one another, the dendrogram reveals:
- Which species merge first
- Which neighbourhoods remain tightly coherent
- Which assemblages only join at broader ecological scales
- Which species remain relatively isolated from the rest of the system
The result feels less like a classification table and more like a structural map of seasonal ecological organisation.
The Emergence of Seasonal Neighbourhoods
Some of the resulting neighbourhoods appear immediately recognisable - for instance, resident passerines form one broad region of the hierarchy, although even within that structure smaller internal neighbourhoods remain visible.
Spring seasonal flora and insects form another coherent grouping, including species such as:
- Bluebell
- Garlic Mustard
- Cow Parsley
- Cowslip
- Orange Tip Butterfly
Despite crossing taxonomic boundaries entirely, the grouping itself feels ecologically plausible because all five species participate strongly in the same spring seasonal transition.
Elsewhere, winter-associated species separate more distinctly from the broader spring and resident structure. Redwing, in particular, remains unusually isolated within the hierarchy, reflecting its highly concentrated winter seasonal signal.
The resulting structure increasingly resembles overlapping seasonal ecological neighbourhoods rather than formal biological categories.
The Importance of Distance
One particularly useful aspect of the dendrogram is that it exposes relative ecological distance directly. Species which merge very close together within the hierarchy appear to share highly similar seasonal structure. More distant joins, by contrast, suggest broader or weaker ecological relationships. This becomes especially useful when examining transitional species.
Some species sit comfortably inside highly coherent neighbourhoods, while others appear to bridge multiple regions of the hierarchy simultaneously. That ambiguity feels important rather than problematic.
Real ecological systems rarely contain perfectly isolated assemblages. Instead, they contain gradients, overlaps, transitional states, and nested structure operating at multiple scales simultaneously.
The dendrogram now appears to be recovering at least some of that behaviour naturally from long-term observational seasonality alone.
Visualising the Hierarchy
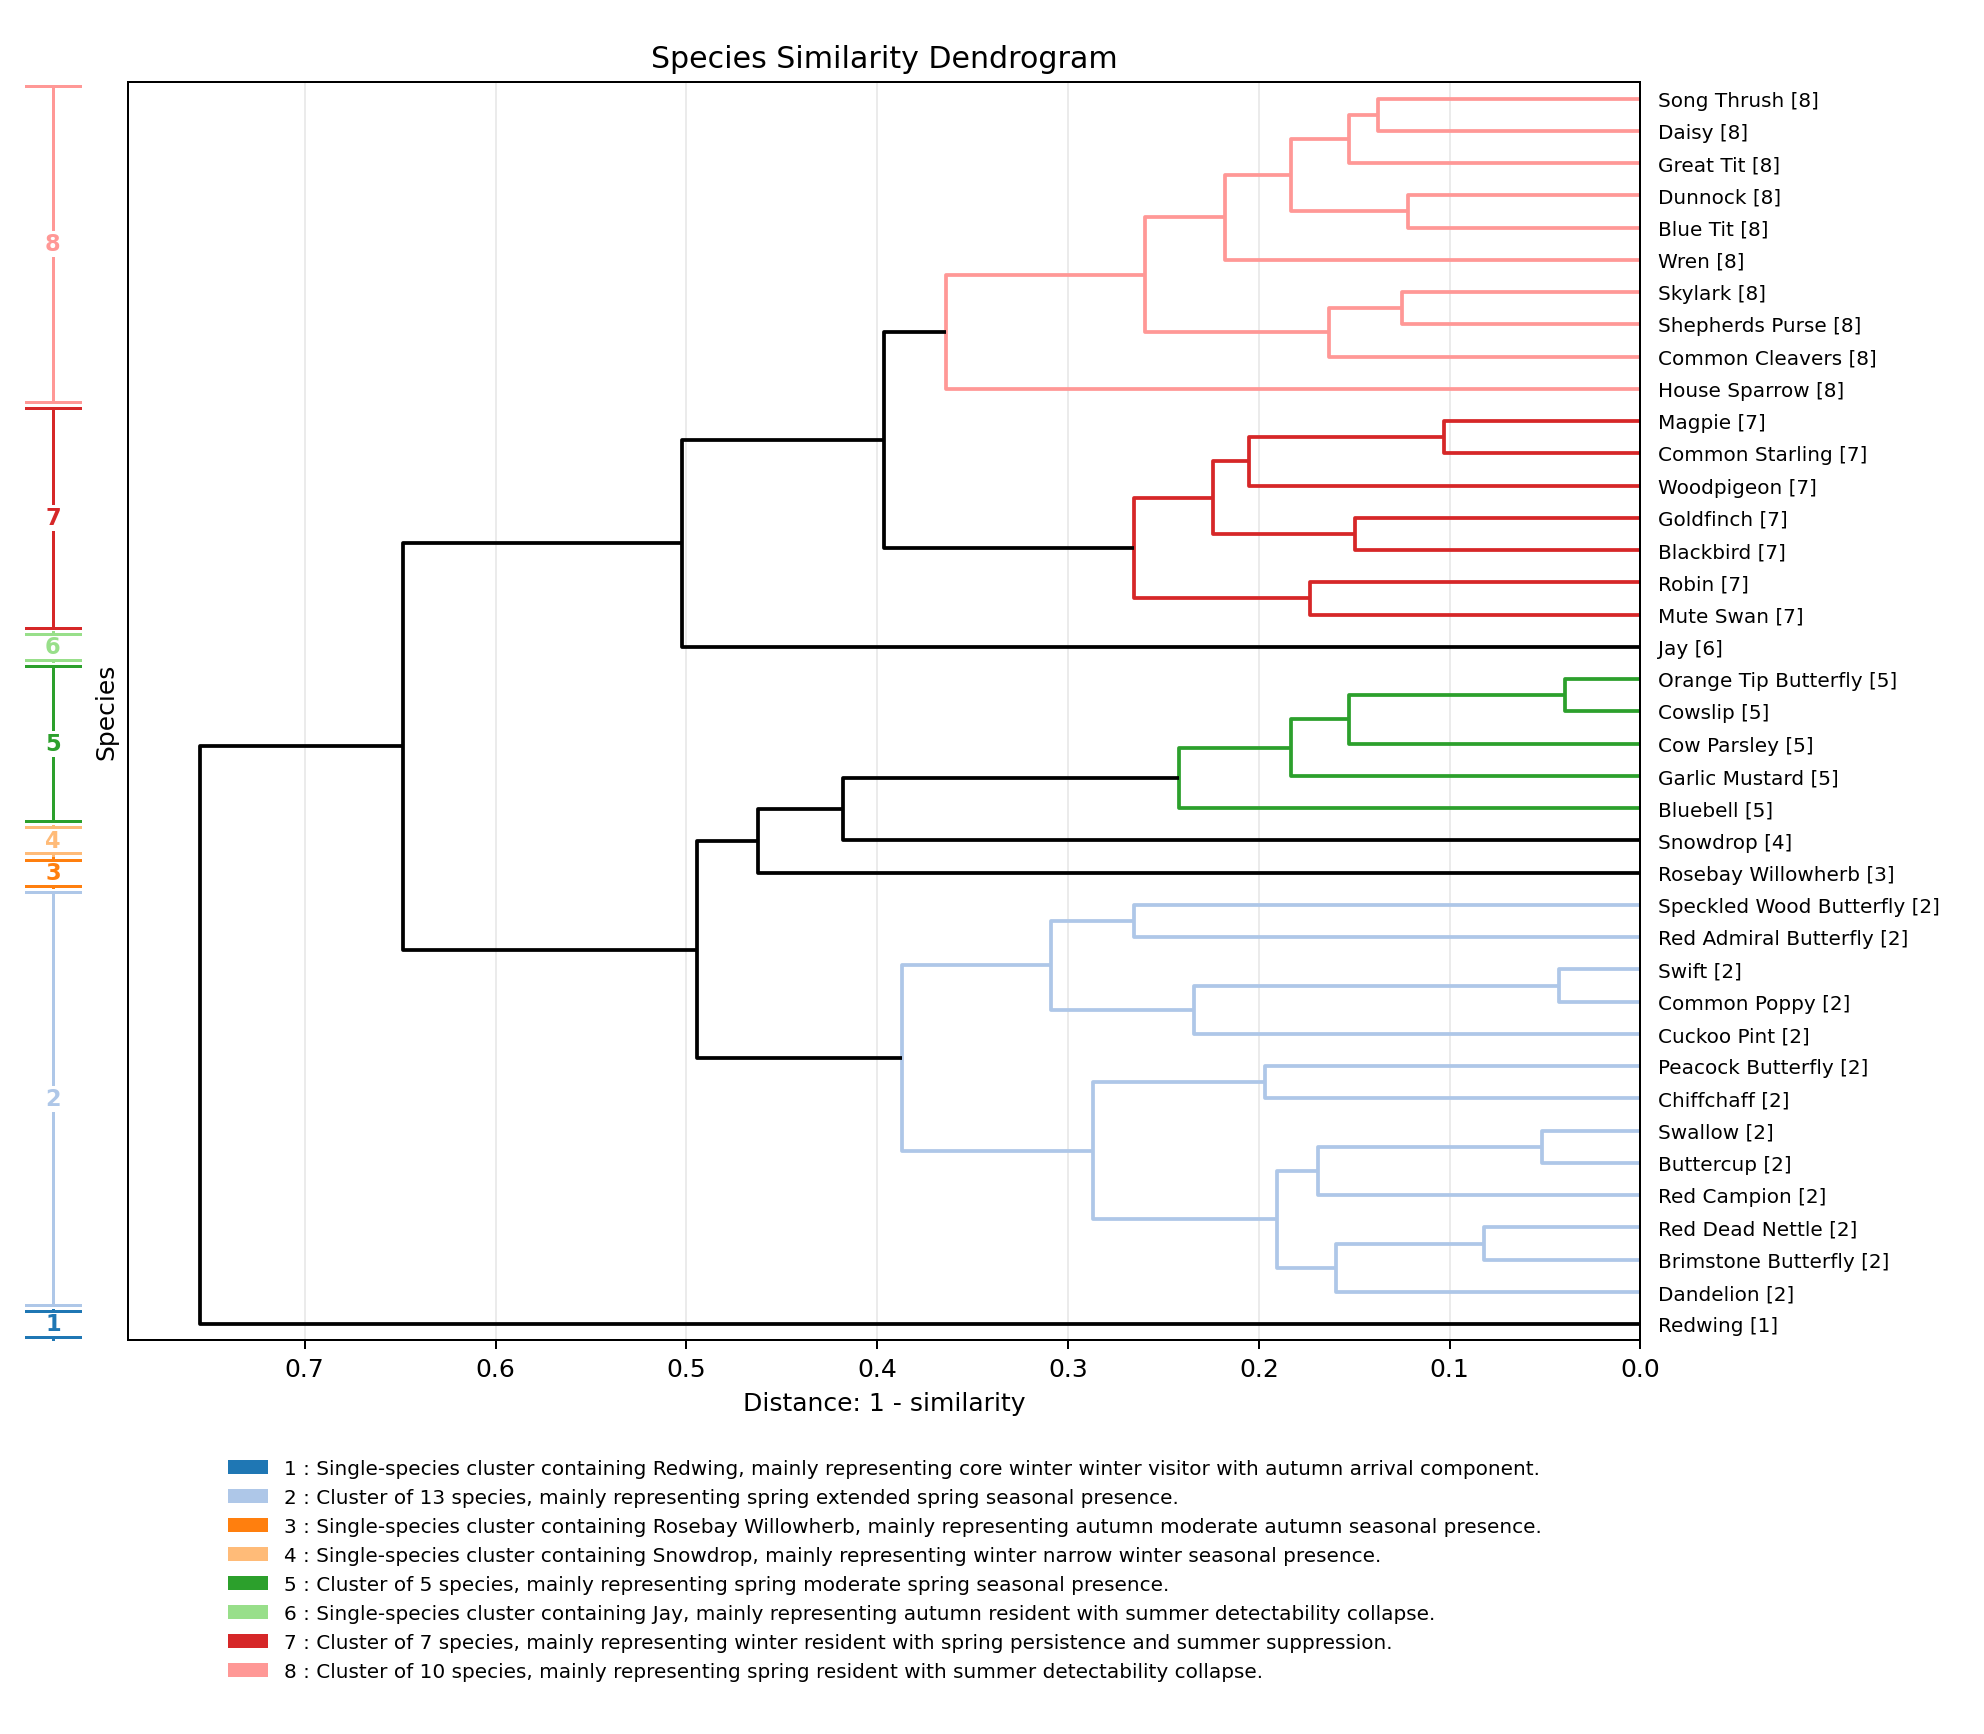
The coloured cluster labels shown along the hierarchy represent one possible partitioning of the structure at a particular resolution.
Importantly, however, the dendrogram itself remains continuous. The hierarchy can be cut at different levels to reveal broader or narrower ecological neighbourhoods depending on the scale being explored.
At coarse resolutions, the system separates into large seasonal regions:
- Winter visitors
- Spring seasonal species
- Resident assemblages
At finer resolutions, progressively smaller neighbourhoods begin to emerge within those broader structures. Neither view is necessarily more correct than the other - they simply represent different scales within the same seasonal hierarchy.
Beyond Pairwise Similarity
The earlier heatmap stage explored pairwise relationships between species while the dendrogram changes the perspective slightly Rather than asking:
Which species are similar?
The hierarchy begins to ask:
How is the seasonal ecological structure organised overall?
That distinction feels surprisingly important.
The system is no longer simply comparing individual species. It is beginning to recover broader structural relationships within the seasonal ecology itself.
At present, the results remain exploratory and heavily dependent on the feature extraction and similarity framework used to generate them.
Nevertheless, the emerging hierarchy already appears substantially more ecological than a purely statistical clustering exercise might have suggested.
The most interesting outcome, perhaps, is that the structure does not appear artificially tidy. Instead, the hierarchy contains:
- Strong neighbourhoods
- Transitional bridges
- Nested assemblages
- Partial overlaps
- Ambiguous edge cases
For now, at least, that ambiguity feels less like failure and more like ecology.
Tool
ODE Solver
A simple tool for exploring time-based models
The seasonal presence and detectability models were developed using a small, general-purpose ordinary differential equation solver, designed for experimentation and visualisation.
It allows simple systems to be defined and explored over time, making it possible to test how patterns might arise from underlying processes.
The application, the models, and instructions on how to run them are provided in the GitHub repository.