
Field Notes Journal Entry
Seasonal Models: Three Patterns
Extending the simple seasonal models to three distinct ecological patterns: resident, seasonal, and winter visitor species
In an earlier post, I explored whether simple processes could reproduce the seasonal patterns seen in long-term wildlife records.
That work began with two broad ideas:
- Some species are present only within a defined seasonal window
- Others are present year-round, but vary in how easily they are seen
Since then, the models have been extended and refined. What has emerged is a clearer separation into three distinct patterns, each with its own simple model.
Three Seasonal Patterns
Looking across species, most fall into one of three groups:
- Resident species, present throughout the year but varying in detectability
- Seasonal species, appearing within a bounded window
- Winter visitors, present across the year boundary, with a winter peak
Each of these can be reproduced with a small set of assumptions.
Resident Detectability (Robin)
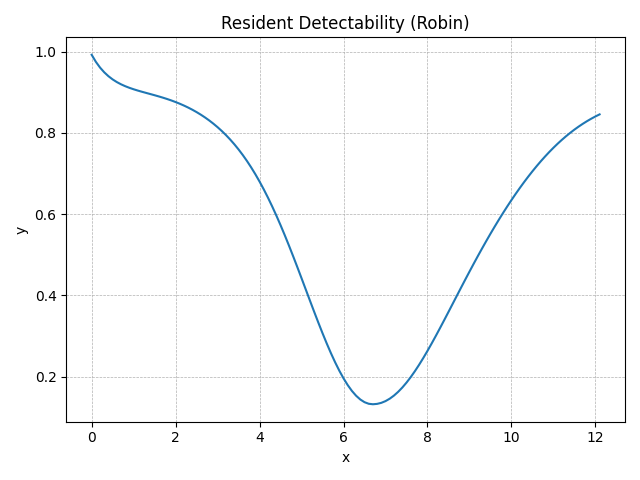
The robin is present all year, but its visibility changes.
The model does not create or remove presence. Instead, it defines a seasonal pattern of expected detectability, and allows the observed signal to move towards it.
The result is a continuous curve:
- Highest in winter and early spring
- Lowest in mid-summer
- Rising again towards the end of the year
This reflects behaviour and observation conditions rather than true absence.
Seasonal Presence (Swift)
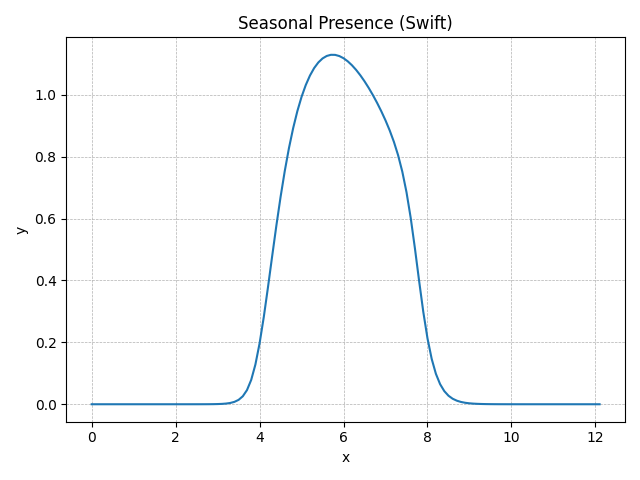
Species such as swift follow a different pattern.
They arrive, occupy a narrow part of the year, and then disappear again. The model combines:
- A seasonal driver
- A bounded window of possible presence
- A decay term outside that window
Together these produce a single, well-defined pulse:
- A rapid rise on arrival
- A short period of peak activity
- A relatively sharp decline
This captures the brevity of strongly seasonal species.
Winter Presence (Redwing)
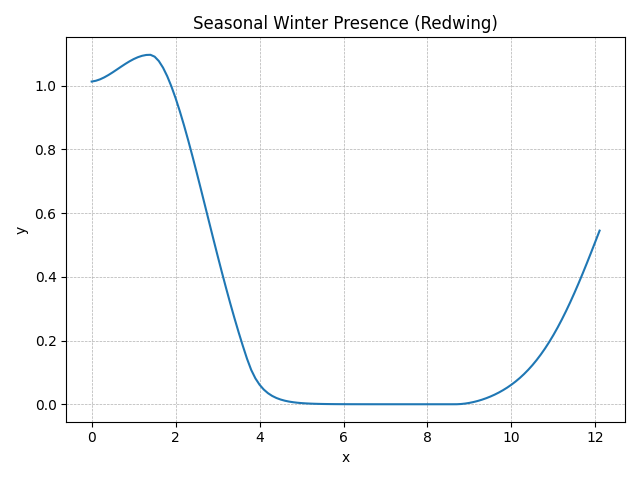
Winter visitors required a small extension.
Their presence spans the end and beginning of the year, which means the model has to handle time as a circular quantity. In addition, many species show:
- A main winter peak
- A weaker autumn arrival component
- A prolonged absence through summer
The resulting curve:
- Rises through autumn
- Peaks in mid-winter
- Falls away into spring
- Remains close to zero through summer
This captures the characteristic “winter-only” signal seen in species such as redwing.
From Shapes to Parameters
Up to this point, the focus has been on whether the models can reproduce the general shapes seen in the data.
The next step has been to fit these models to real observations.
Rather than choosing parameters by hand, a simple fitting process searches for values that best match the observed monthly patterns. This produces, for each species:
- A set of fitted parameters
- A simulated curve
- A measure of how well the model matches the data
Importantly, the parameters are not just numerical. They correspond to interpretable features:
- Timing of peaks
- Width of the active season
- Strength of seasonal components
- Degree of absence outside the season
In this way, each species begins to acquire a small “ecological signature”.
A Working Framework
What began as a simple exercise has started to take on a more structured form:
- three complementary models, each suited to a different ecological pattern
- a fitting process to connect models to observed data
- a way of describing species in terms of seasonal behaviour
The aim remains modest. These are not detailed ecological simulations, and they are not intended to predict future observations.
Yet they provide a consistent way of linking observation and process:
- The Seasonal Analyses describe what is seen
- The models suggest how those patterns might arise
And, perhaps more usefully, they allow comparisons to be made across species in a consistent way.
Next Steps
The immediate next step is to apply the models more widely across the working set of species.
This should provide:
- A broader range of fitted parameters
- Examples of where the models succeed and where they struggle
- A clearer sense of how species differ in their seasonal behaviour
From there, the intention is to incorporate these results into the Field Notes pages, so that each species carries not just a description of its pattern, but a simple, comparable summary of its seasonal dynamics.
For now, though, the main result is straightforward:
A small number of simple models are enough to reproduce many of the patterns seen in the year