
Field Notes Entry
Echoes from the Past
Returning to bat recording this spring, revisiting old pipistrelle recordings from 1999 and building a simple pipeline to turn sound into visible structure.
With spring properly underway, the local bats should now be out of hibernation and feeding again. It felt like a good moment to return to listening for them — and to do it a little more deliberately this year.
I have two detectors:
- A Magenta Bat Mk II (heterodyne), built from a kit more years ago than I care to remember, that’s used for real-time listening
- A Pettersson D-140 for both heterodyne and time-expansion recording
Between them, they give a nice combination of immediacy and detail: the heterodyne for finding and following bats in the field, and the time-expansion for capturing recordings that can be examined more closely later.
A Starting Point: Recordings from 1999
Before heading out, I went back to some older material — recordings of pipistrelles dating from 1999.
They were originally captured using the D-140 and stored in a very different workflow (cassette at the time!). Listening to and being able to visualise them properly again is a reminder of just how much information is contained in even a short snippet of audio.
Those old recordings have become a useful test case for building and refining a simple processing pipeline.
From Recording to Spectrogram
The aim has been to keep things simple and repeatable — something that fits naturally alongside the rest of the Field Notes work.
The basic pipeline looks like this:
Record
- Use the heterodyne detector to locate bats
- Use the D-140 in time-expansion mode to capture short recordings
This produces audio where ultrasonic bat calls are slowed down into the audible range.
Clean the audio
The raw recordings often contain a fair amount of background hiss and low-frequency noise. In Audacity I apply a light-touch clean-up:
- A small amount of noise reduction
- A high-pass filter to remove low-frequency rumble
- Normalisation to bring the signal up to a usable level
The aim is not to “perfect” the recording, but simply to make the signal clearer without altering its structure.
Generate a spectrogram
The cleaned WAV file is then passed into a small Python tool, built with librosa and matplotlib, that:
- Computes a Short-Time Fourier Transform (STFT)
- Converts the result into decibels
- Displays both:
- The waveform (timing)
- And the spectrogram (frequency over time)
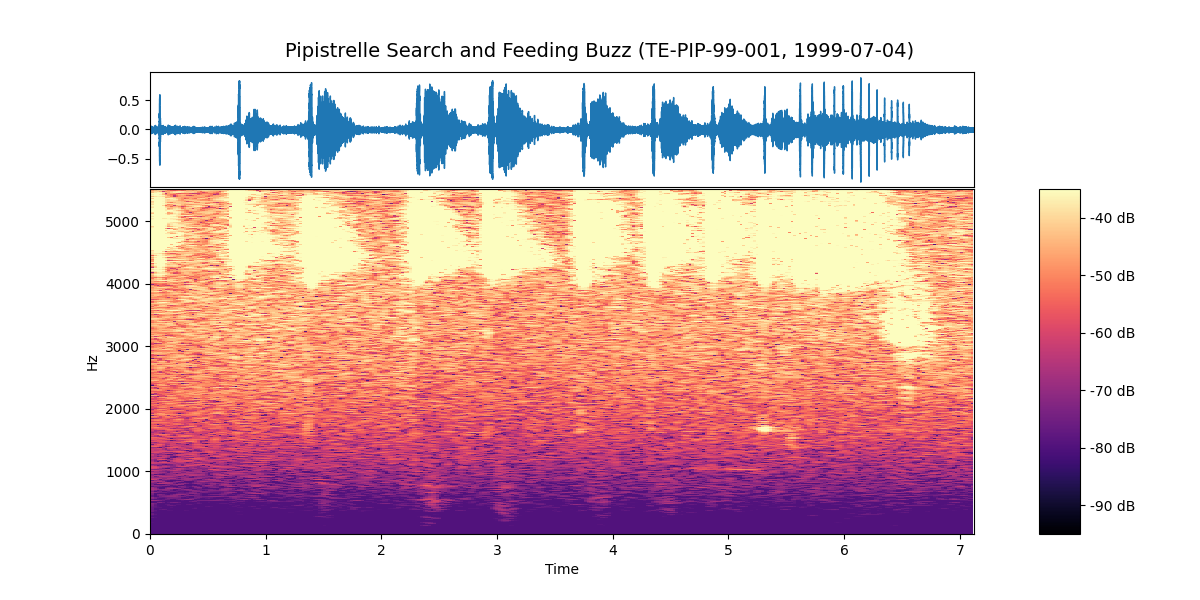
Inspect and interpret
The result is a combined view where it becomes much easier to see what is happening. Even a short pipistrelle recording typically shows:
- A regular sequence of calls during search flight
- Tightening spacing as the bat approaches prey
- And, sometimes, the distinctive “feeding buzz”
What is heard as a rapid clicking becomes, visually, a structured sequence of events.
Why this approach
The goal isn’t to build a complex analysis system, but to create a simple, consistent way of:
- capturing recordings
- making them easier to interpret
- and linking them back to observations in the field
It’s another layer of “field notes” — this time acoustic rather than visual.
Next steps
With the pipeline in place, the next step is simply to head out at dusk and start collecting new recordings again.
It will be interesting to see how this year’s observations compare with those older recordings — and whether the same patterns emerge.